Join Our Telegram channel to stay up to date on breaking news coverage
Bitcoin (BTC) Price Prediction – April 18
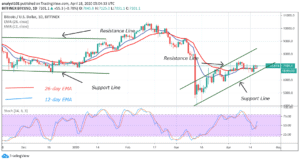
Uncertainty arises as BTC/USD pair continues to hold above $7000 resistance since April 16. The market has earlier reached a high of $7,200 but was repelled. Bitcoin dropped to $6,600 low and rebounded immediately.
Key Levels:
Resistance Levels: $10,000, $11, 000, $12,000
Support Levels: $7,000, $6,000, $5,000

Buyers are unrelenting as they came back above the $7,000 resistance. The market has been holding since on Thursday, April 16. Can the bulls sustain hold above the resistance and continue its upward move? Certainly, buyers will face resistance if they push price above $7,200 and $7,400 levels. Earlier attempts by the bulls were scuttled by the bears. On each attempt the market has nosedived to $6,600 low.
Bitcoin will be making a remarkable move if those levels are crossed. Firstly, the uptrend will resume in earnest and its target price of $8,000 will be achieved. The current momentum will extend above the $9,000. Nonetheless, if BTC failed to rise above $7,400, the market will fall or be compelled to a sideways move. Bitcoin is above 50% range of the daily stochastic. It implies that it is in a bullish momentum. The market has already risen above $7,000 resistance. The bulls have continued to sustain current momentum as price is above the EMAs.
BTC/USD Medium-term Trend: Ranging (4-Hour Chart)
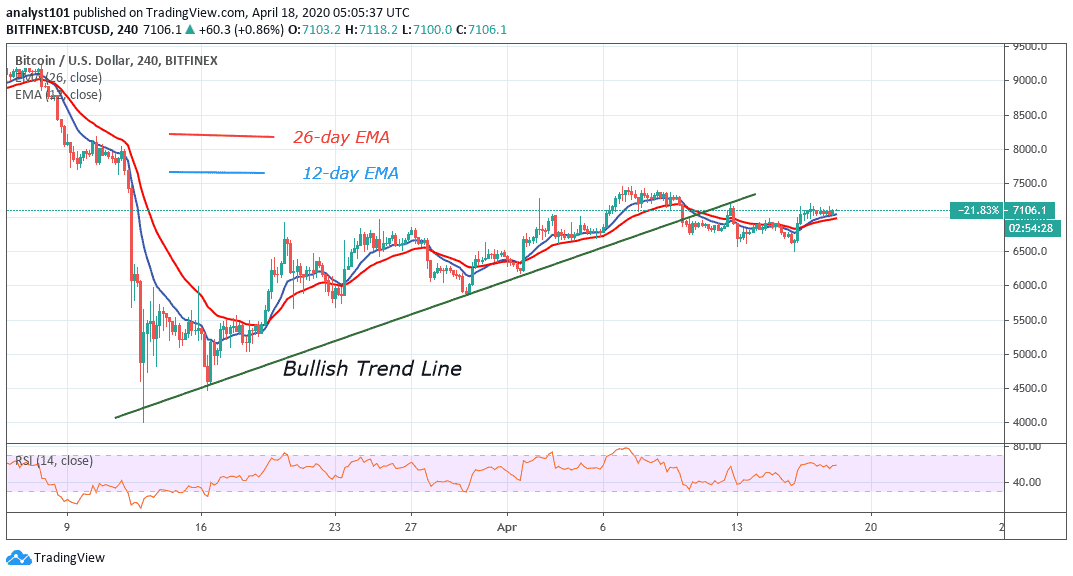
On the 4 hour chart, Bitcoin has created three levels of resistance in April. At first, the market reached a high of $7,400 and after two days of trading, it fell to $6, 750 low. Secondly, the bulls moved up again to $7,200 and were resisted. Presently, BTC is trading below $7,200 for the past three days. The Relative Strength index period 14 indicates that Bitcoin is at level 58 and above the centerline 50. It implies that it is in the uptrend zone.
Please note: Insidebitcoins.com is not a financial advisor. Do your research before investing your funds in any financial asset or presented product or event. We are not responsible for your investing results.
Join Our Telegram channel to stay up to date on breaking news coverage