Join Our Telegram channel to stay up to date on breaking news coverage
Bitcoin (BTC) Price Prediction – April 23
BTC/USD has skyrocketed by more than 10% over the last 24 hours, reaching an intraday high of $7,784.26.
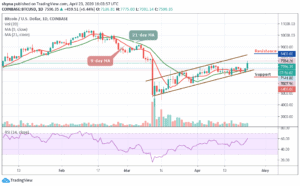
BTC/USD Long-term Trend: Bullish (Daily Chart)
Key levels:
Resistance Levels: $8,400, $8,600 $8,800
Support Levels: $6,400, $6,200, $6,000

Within a few quick hours, BTC/USD jumps over $500 in hours. The Bitcoin’s price marked a massive increase, surging up above $7,700 from about $7,007.96. Similarly, the price of Bitcoin has since retraced a bit as it’s currently trading around $7,596, which is still about 6.44% on the day. More so, the Bitcoin (BTC) made a serious move in the past few hours as its price soared up to $7,784 in just a few minutes.
According to the daily chart, BTC/USD traded around $7,141 for the majority of the time today, but it started moving up and reached a daily high of about $7,784. Even though the price was rejected there, it’s still trading at a nice 6.44% increase on the day. According to this latest increase, BTC/USD has almost fully recovered from the crash that took place on March 12 to 13. However, the market is deciding above the 9-day and 21-day moving averages, where the bulls are anticipating a clear breakout above the channel.
Moreover, a strong bullish spike may likely take the price to $8,400, $8,600, and $8,800 resistance levels. More so, if the market makes a quick turn to the south, the BTC/USD price may likely drop below the moving averages; Investors may see a further roll back to $6,400, $6,200, and critically $6,000. Similarly, the RSI (14) lies at 59.98-level, and a further spike is likely to hit above 60-level or could easily move into the overbought zone.
BTC/USD Medium-term Trend: Bullish (4H Chart)
Bitcoin price surged upwards of over $500 in the past 24 hours, catapulting its price over $7,000 to reach where it currently trades at around $7,557. This sudden rise also pushed the price overall other altcoins, which increased by more than 5.9% in the respective period. However, the closest resistance levels lie at $7,800 and $8,000, while the nearest supports are $7,300 and $7,100 respectively.
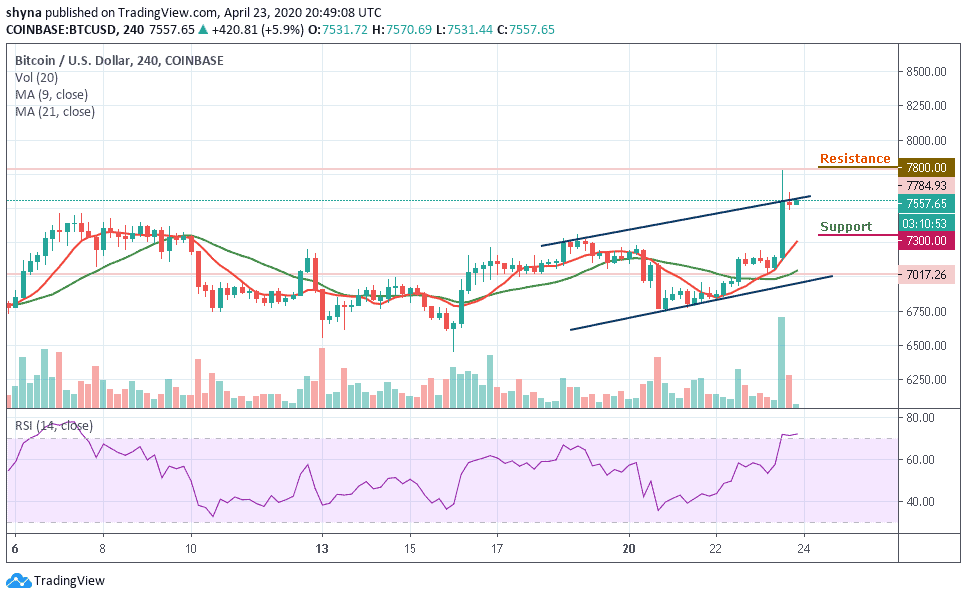
Moreover, as the coin moves above the ascending channel, the technical indicator is strongly bullish and still flashing buy signals. After touching the high of 7,784 today, the RSI indicator moves into the overbought zone along with the price. However, as of writing this, the indicator had encountered tough resistance above 70-level.
Please note: Insidebitcoins.com is not a financial advisor. Do your research before investing your funds in any financial asset or presented product or event. We are not responsible for your investing results.
Join Our Telegram channel to stay up to date on breaking news coverage