Join Our Telegram channel to stay up to date on breaking news coverage
Bitcoin (BTC) Price Prediction – May 13
The Bitcoin price is renewing bullish momentum towards the $9,000 resistance level.
BTC/USD Long-term Trend: Bullish (Daily Chart)
Key levels:
Resistance Levels: $10,000, $10,200, $10,400
Support Levels: $7,500, $7,300, $7,100
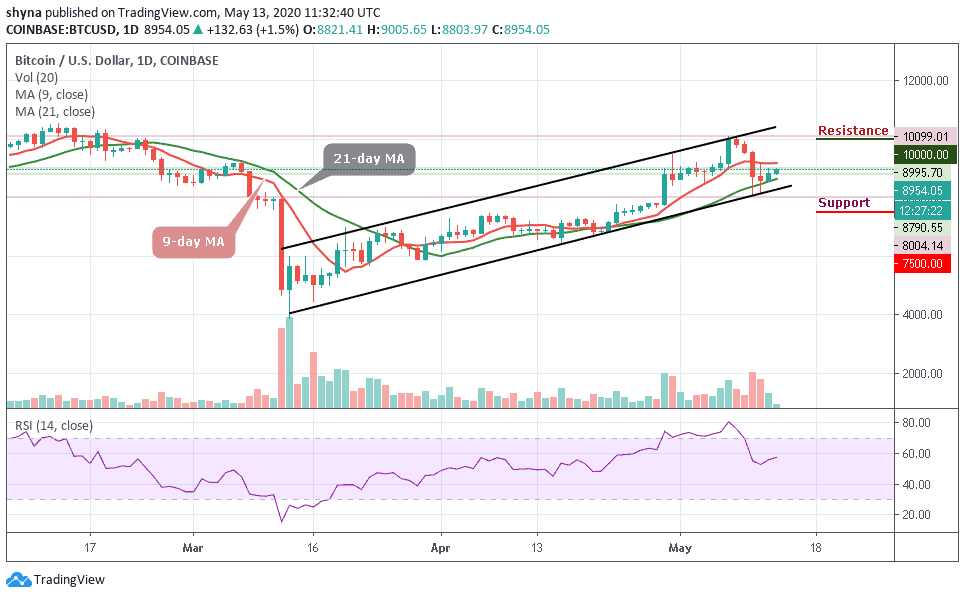
Today, BTC/USD is currently gaining more than 1.5% overnight and has remained unchanged since the start of the day. The first digital coin is recovering from the intraday low of $8,790 to trade at $8,995 at the time of writing. The market price has not been able to cross above the 9-day moving average and this barrier prevents BTC from moving towards $9,000. Once it is cleared, the recovery may be extended towards the $9,500 resistance level.
Meanwhile, as long as the 9-day remains above the 21-day moving averages, Bitcoin Era traders can expect BTC to consolidate at higher levels. That’s if we could see a further climb above the $9,000 which is fast approaching; it may likely reach the resistances at $10,000, $10,200, and $10,400. Nevertheless, the critical support level to watch for lies at $7,500, $7,300, and $7,100 respectively.
More so, the daily chart now reveals that the Bitcoin price is following a dominant bullish bias. Taking a look at the technical indicator, RSI (14) displays a positive movement of the coin in the near-term. Besides, maintaining a gradual upward slope towards 60-level, the technical indicator is now increasing as a signal for growing buying entries.
BTC/USD Medium-Term Trend: Ranging (4H Chart)
Looking at the 4-Hour chart, the price of Bitcoin is hovering around $9,100 and the market could easily move above $9,000 conveniently as the bulls are pushing the price to cross above the channel. More so, if the bulls can apply more strength, the upward movement may be able to near the $9,800 and $10,000 resistance level.
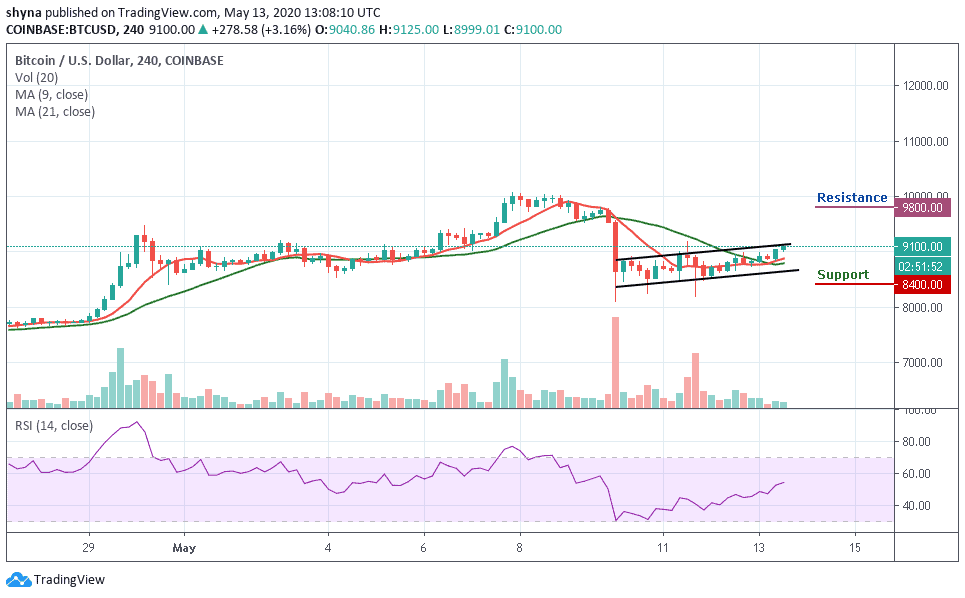
However, on the downside, immediate support is around the $8,700 level below the moving averages and the price may likely fall below $8,500 if the bears step into the market, a further bearish movement could hit the support at $8,400 and $8200 levels. Meanwhile, the technical indicator RSI (14) is moving above 50-level, indicating an upward movement
Please note: Insidebitcoins.com is not a financial advisor. Do your research before investing your funds in any financial asset or presented product or event. We are not responsible for your investing results.
Join Our Telegram channel to stay up to date on breaking news coverage