Join Our Telegram channel to stay up to date on breaking news coverage
Bitcoin Price Prediction – January 28
The Bitcoin price prediction reveals that BTC is currently hovering at $37,314 after slipping below $36,500 a few hours ago.
BTC/USD Long-term Trend: Bearish (Daily Chart)
Key levels:
Resistance Levels: $44,000, $46,000, $48,000
Support Levels: $31,000, $29,000, $27,000
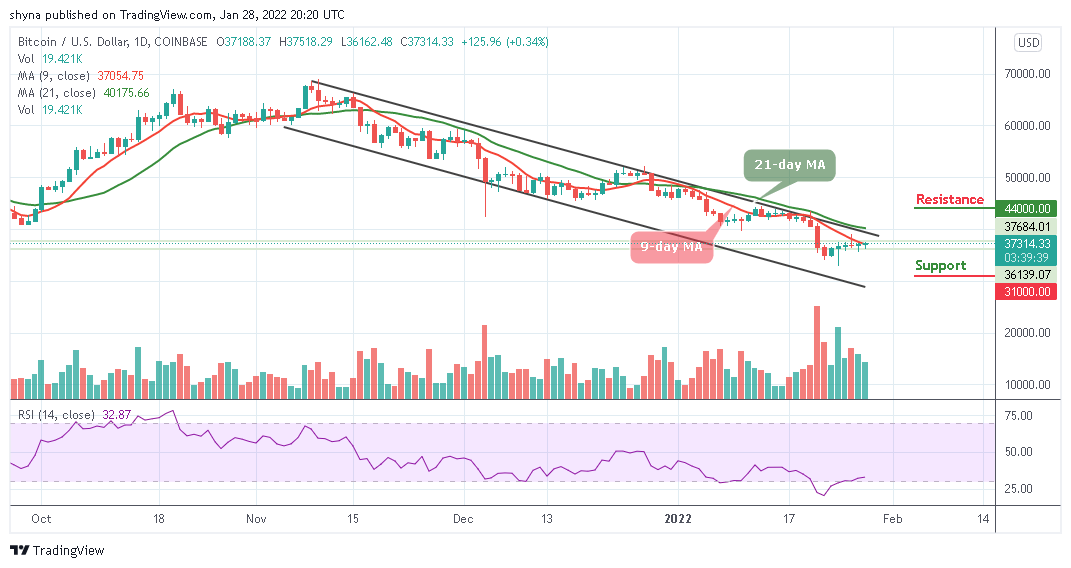
BTC/USD bulls are coming up into the market as the king coin moves to cross above the 9-day moving average, this latest move marks a slight upwards toward the north, but it is important to note that it has not led BTC past any key technical level. However, the Bitcoin (BTC) has been consolidating over the past few days, struggling to gain any momentum as the entire market’s uptrend stalls.
Bitcoin Price Prediction: Would Bitcoin (BTC) Go Up?
The Bitcoin price is trading up marginally at its current price of $37,314. Although this only marks a slight climb from where it has been trading throughout the past several days, but it is important to note that this seems to mark a bull-favouring break above the 9-day moving average of the tight trading range seen over the past few days.
However, as the technical indicator Relative Strength Index (14) moves out of the oversold region, a sustainable move above the upper boundary of the channel may locate the potential resistance of $44,000, reaching this may also allow for an extended recovery towards $46,000 and $48,000 respectively. Meanwhile, an increase in selling pressure may force the RSI (14) to cross below 25-level and move towards the supports at $31,000, $29,000, and $27,000.
BTC/USD Medium-Term Trend: Ranging (4H Chart)
On the 4-hour chart, BTC/USD may recover above the upper boundary of the channel to mitigate the short-term bearish pressure, and this may allow for an extended recovery towards the resistance level of$38,000. A higher resistance may be found at $39,500 and above.
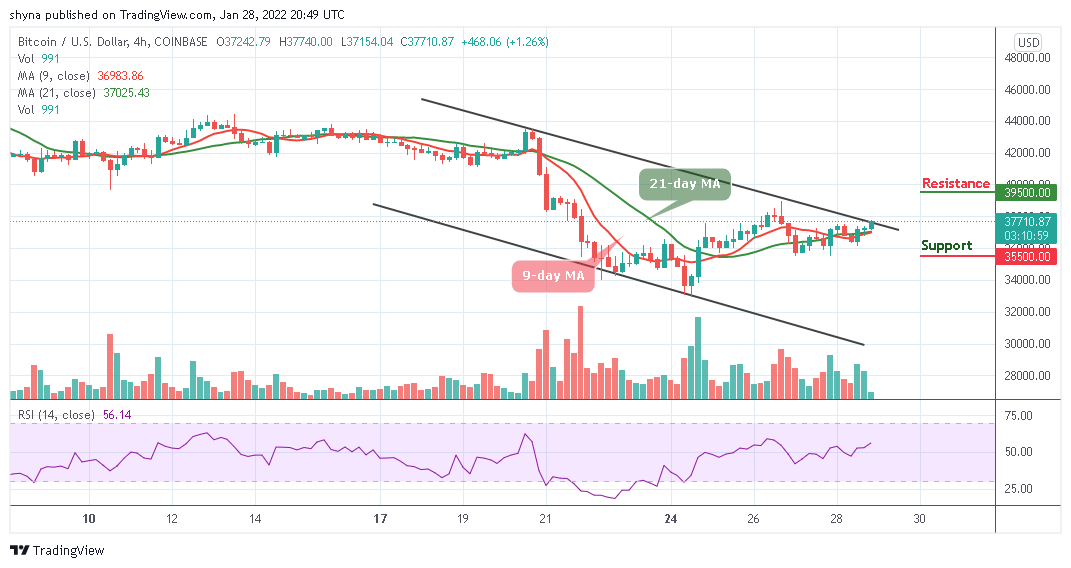
On the other hand, the nearest support is located below the 9-day and 21-day moving averages, and a sustainable move below this barrier may increase the downside pressure and push the price towards the support level of $35,500 and below. More so, the technical indicator Relative Strength Index (14) is moving to cross above 60-level for more bullish signals to come into focus.
Looking to buy or trade Bitcoin (BTC) now? Invest at eToro!
68% of retail investor accounts lose money when trading CFDs with this provider
Read more:
- How to buy Bitcoin
- How to buy Cryptocurrency
Join Our Telegram channel to stay up to date on breaking news coverage