Join Our Telegram channel to stay up to date on breaking news coverage
Bitcoin (BTC) Price Prediction – April 26
BTC/USD pair has continued to consolidate above $7,500 support after price rally. The market is relatively stable with small body indecisive candlesticks. Bitcoin is expected to extend its rally to $8,000 or face rejection.
Key Levels:
Resistance Levels: $10,000, $11, 000, $12,000
Support Levels: $7,000, $6,000, $5,000
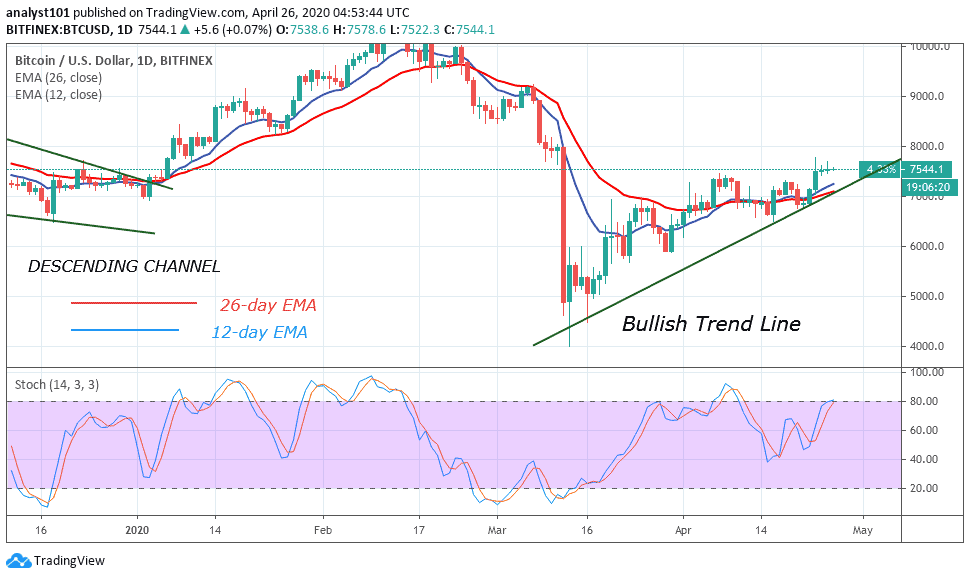
For the past four days, BTC is consolidating above $7,500 but undecided about the next move. Nonetheless, from the price action, there is the appearance of a shooting star. It is a candlestick with a small body and an upper long shadow. This candlestick indicates a bearish reversal signal. It also explains that buyers push price upward but faces rejection by selling pressure. Bitcoin’s upward move is doubtful as the market ends its consolidation above $7,500.
Similarly, BTC is almost above 80% range of the daily stochastic. This indicates that the coin is in the overbought region. Certainly, if the market is said to be overbought, then it becomes unavoidable to face selling pressure. On the downside, BTC may fall and find support at $7,200. The market will continue its downward move to $6,800 if the $7,200 support cracks. However, further losses may reach the lows of either $6,600 or $6,400.
BTC/USD Medium-term Trend: Ranging (4-Hour Chart)
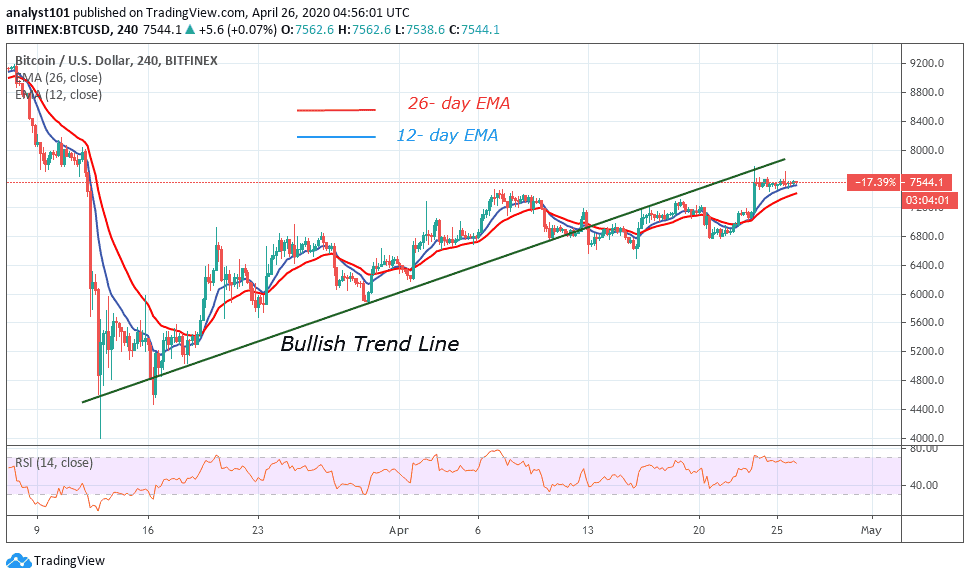
On the 4 hour chart, BTC is in an upward move, but it is currently in a sideways trend. It is consolidating above 12-day EMA and 26-day EMA. However, after consolidation, if the price breaks below the EMAs, it indicates the resumption of selling pressure. Conversely, if price shoots up is an indication of an uptrend. BTC may face major resistance at the $8,000 price level. In the meantime, the BTC is at level 66 of the Relative Strength Index period 14. It indicates that the market is in the uptrend zone and BTC is likely to rise.
Please note: Insidebitcoins.com is not a financial advisor. Do your research before investing your funds in any financial asset or presented product or event. We are not responsible for your investing results.
Join Our Telegram channel to stay up to date on breaking news coverage