Join Our Telegram channel to stay up to date on breaking news coverage
Bitcoin (BTC) Price Prediction – May 5
The Bitcoin price recovers from the dip to touch $9,143; all eyes focus on $9,500 and $10,000 resistance levels.
BTC/USD Long-term Trend: Bullish (Daily Chart)
Key levels:
Resistance Levels: $10,200, $10,400, $10,600
Support Levels: $7,700, $7,500, $7,300
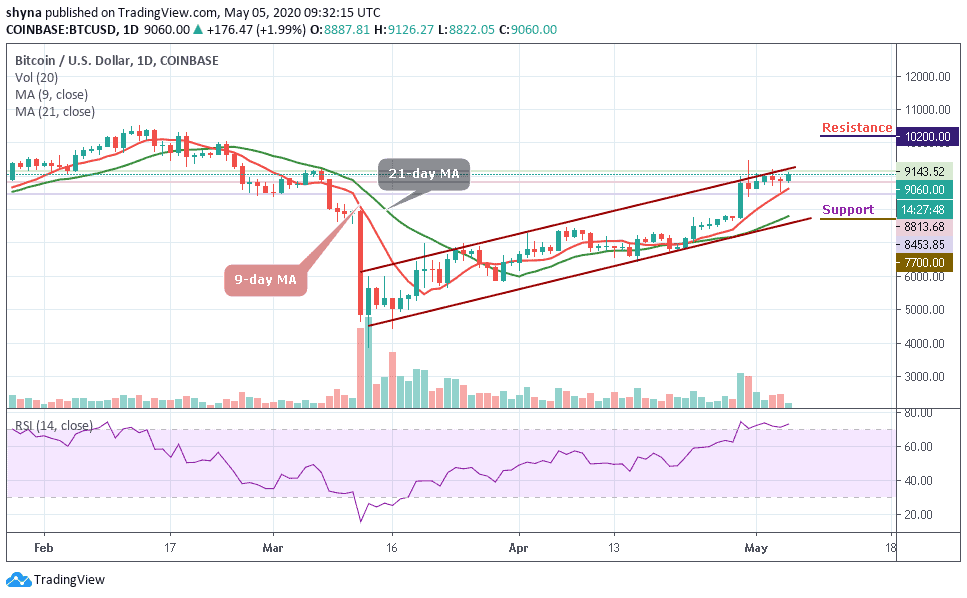
BTC/USD has hit the price area around $9,000 after almost a few days of despairing trade. Since the coin is currently correcting upwards, we believe that BTC/USD is likely to cross resistances instead of just battling inactive supports. Today, BTC/USD was seen touching $9,143 but currently trading at $9,060 after closing at $8,843 yesterday.
However, the coin then pulled back today to where it is trading currently and may continue to head upward if the bulls fully step back into the market. The daily chart reveals that BTC/USD trading above the crucial levels that will now function as the support zones in the event a reversal occurs.
On the upside, as the coin moves toward the upper channel, the nearest resistance level lies at $9,400 and if the technical indicator remains with the overbought territory, the market may reach the potential resistance at $10,200, $10,400 and $10,600 respectively.
More so, as the RSI (14) moves within the overbought zone, the signal line may likely drop below 70-level and any heavy drops may hit the support levels at $7,700, $7,500, and $7,300.
BTC/USD Medium – Term Trend: Ranging (4H Chart)
The 4-hour chart for BTC/USD is still trading in sideways, but the market has been showing a sign of bullish trend since the daily opening. However, the intraday trading is still looking bullish; following the recent rebound at $8,767 which is now a key support level. The next key support levels are $8,400, $8,200 and $8,000.
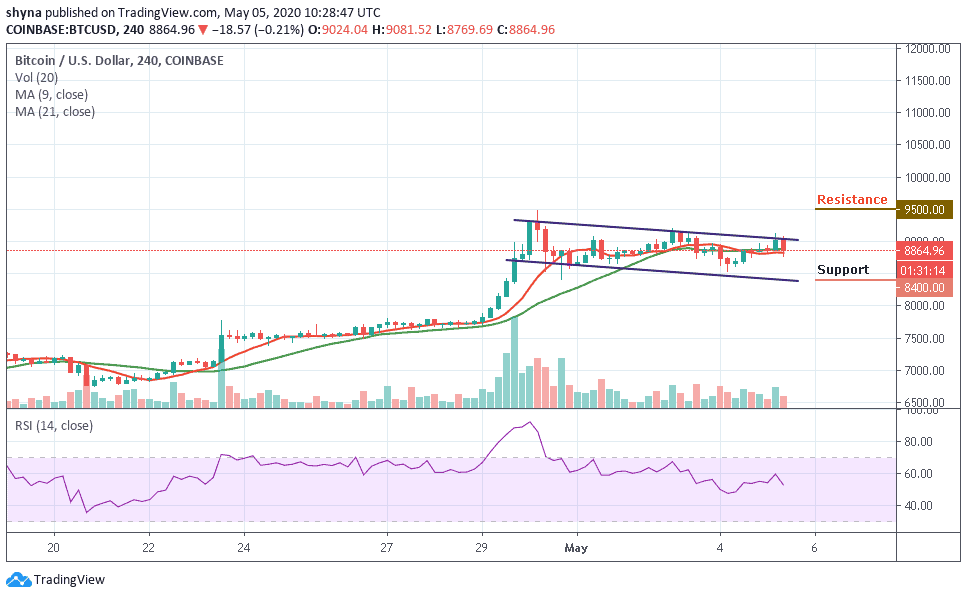
However, in as much as the buyers continue to reinforce and power the market more, traders can expect a retest at $9,100 resistance level, and breaking this level may further push the price towards the resistance level of $9,500 and above. Meanwhile, the RSI (14) faces the south as it is moving below the 54-level.
Please note: Insidebitcoins.com is not a financial advisor. Do your research before investing your funds in any financial asset or presented product or event. We are not responsible for your investing results.
Join Our Telegram channel to stay up to date on breaking news coverage