Join Our Telegram channel to stay up to date on breaking news coverage
Bitcoin Price Prediction – February 27
BTC/USD market operations now trade at a low point around $45,000 after reaching a new-all high a near below $60,000.
BTC/USD Market
Key Levels:
Resistance levels: $55,000, $60,000, $65,000,
Support levels: $40,000, $35,000, $30,000
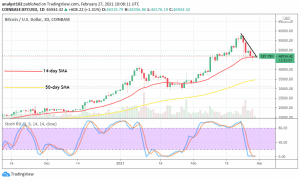
BTC/USD – Daily Chart
A fall-off of price depicting variant bearish candlesticks has formed to touch the 14-day SMA trend-line. The smaller SMA indicator is now bent slightly towards the east direction. The 50-day SMA is far below the 14-day SMA at the $35,000 level. The Stochastic Oscillators are dipped into the oversold region to signify that the downward market move is getting lowered. Most of these showcases that bulls’ strength is not far from being regained in the near time.
Will price of BTC/USD moves further downward below $45,000?
The strength-estimating trading tool shows that the current low trading point at the $45,000 level may potentially serve as vital support that the BTC/USD bulls are expectantly had to muster their capacity to stage a come-back. A low level at $40,000 may be an extension of support for bulls if the $45,000 line slightly breaches to the south. Meanwhile, Extension downward to a low-point around at $35,000 level may not obtain in near trading days’ sessions.
On the downside, as at this point of trading at $45,000 level, bears have to consolidate their stands to hold the price and forcefully push down off the line. The move has to come at a rejection around a $50,000 line to break southward past the $45,000. In the meantime, price may form in different short ups and downs around the current trading zone for a while. A touch of the price at the $40,000 mark will give back to the possibility of letting the bullish trend has a good promising outlook.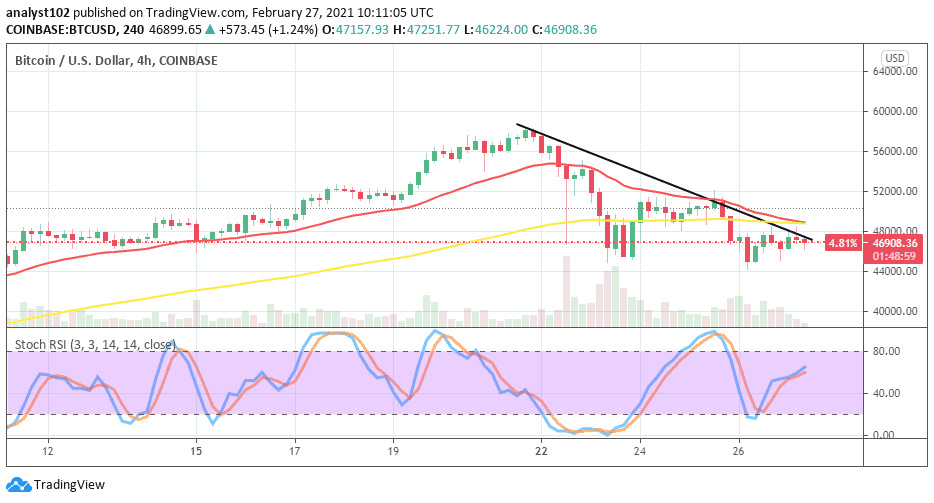
BTC/USD 4-hour Chart
The 4hour trading chart indicates that there has a significant downward move in the BTC/USD trading activities over a couple of trading sessions. After a successful struggle moving a bit above $56,000, the crypto lost catalyst to break past resistance around $60,000 on February 21. The 14-day SMA trading trend-line has curved southward to touch the 50-day SMA’s from the top. Price has been trading a bit below them to create a kind of base-value around the mark of $44,000. The Stochastic Oscillators have placed within 40 and 80 ranges to briefly point north-east direction. That suggests a kind of indecision trading situation which may only last for a short period. However, the $44,000 mark now stands as a good support line for considering a decent entry for upward trend resumption.
Join Our Telegram channel to stay up to date on breaking news coverage