Join Our Telegram channel to stay up to date on breaking news coverage
Bitcoin (BTC) Price Prediction – February 17
Bitcoin price is under pressure below the $10,000 support level but the bears seem to be in control as the price even failed to stay above $9,800.
BTC/USD Long-term Trend: Bullish (Daily Chart)
Key levels:
Resistance Levels: $10,800, $11,000, $11,200
Support Levels: $8,900, $8,700, $8,500
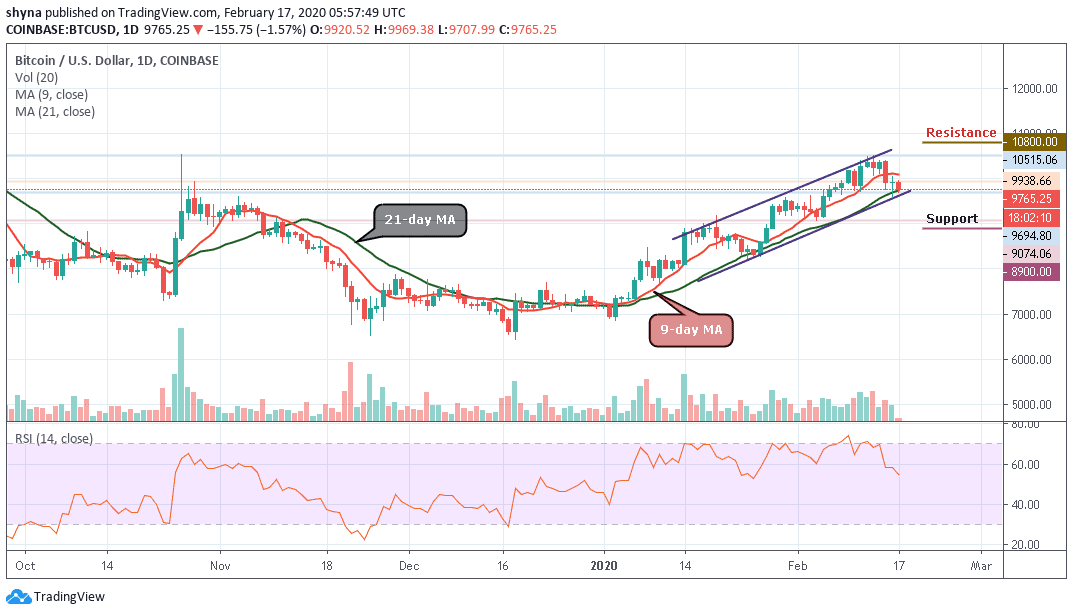
BTC/USD is struggling to secure support above $9,700 following a painful retreat from last week’s highs of $10,515. The trading in the weekend session was characterized mainly by increased selling pressure. With the path of least resistance maintaining the downside, BTC/USD shuttered several support areas including $10,400, $10,200 and the retracement level of the last drop from $10,515 to $9,074 around $10,000.
Meanwhile, BTC/USD is trading at $9,765 amid increased selling activity at the beginning of the European session. The retreat is following a falling wedge pattern as Bitcoin records lower lows and lower highs. Therefore, a successful break above $10,000 and then a follow-up move above the 9-day moving average is needed for a fresh increase towards $10,500 in the near term. The potential resistance levels to watch are $10,800, $11,000 and $11,200.
However, the Ethereum and Ripple are declining heavily, which may perhaps increase pressure on Bitcoin below $9,800.Should in case BTC/USD slides below the $9,600 support, the bears could even aim a break below the key $9,500 support level. As RSI (14) moves around 55-level, a convincing break below the $9,500 level is likely to set the momentum for a run towards the $9,000 level which could lead to the critical support levels of $8,900, $8700 and $8,500 respectively.
BTC/USD Medium – Term Trend: Bearish (4H Chart)
According to the 4-hour chart, the bears are stepping back into the market gradually while the price of Bitcoin (BTC) has dropped below the 9-day and 21-day moving averages heading towards the south where it touched the support level of $9,714. However, if the price breaks below the trend line of the descending channel and continues to fall, further supports may be found at $9,500, $9,300 and $9,100.
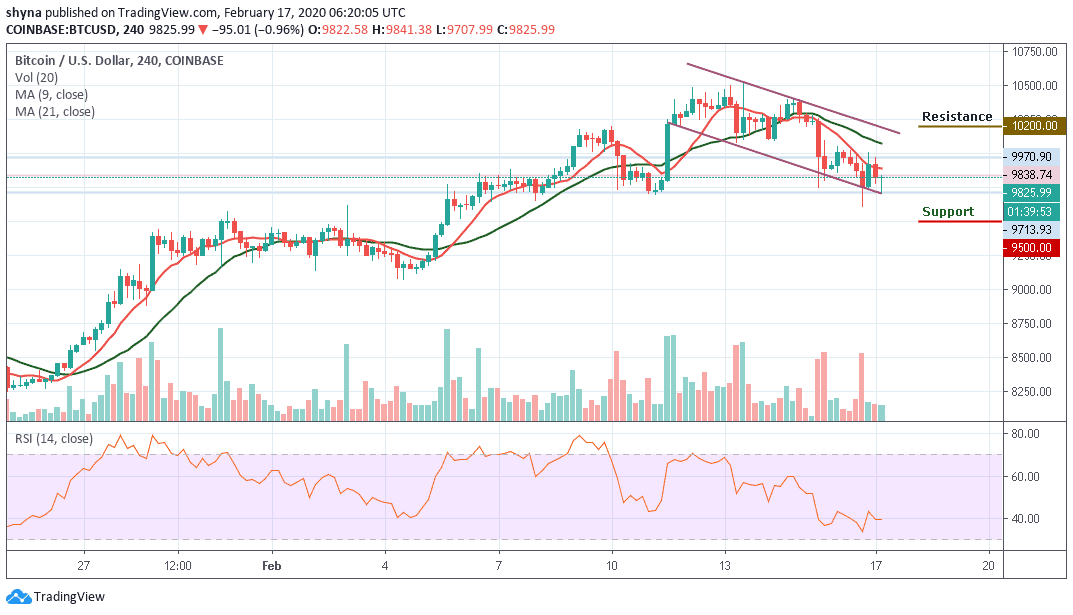
In other words, as the technical indicator RSI (14) is seen moving around 40-level, a rebound may likely push the price back above the $9,900 resistance level. Therefore, breaking the mentioned resistance could also allow the bulls to test the $10,200, $10,400 and $10,600 resistance levels. For now, BTC/USD is consolidating currently and may start moving in sideways on the medium-term outlook which could lead to an increase in volatility soon.
Please note: Insidebitcoins.com is not a financial advisor. Do your research before investing your funds in any financial asset or presented product or event. We are not responsible for your investing results.
Join Our Telegram channel to stay up to date on breaking news coverage