Join Our Telegram channel to stay up to date on breaking news coverage
Bitcoin (BTC) Price Prediction – July 19
BTC/USD price is slowly approaching crucial supports; the bears need to be very careful once the price reaches the $9,000 support level.
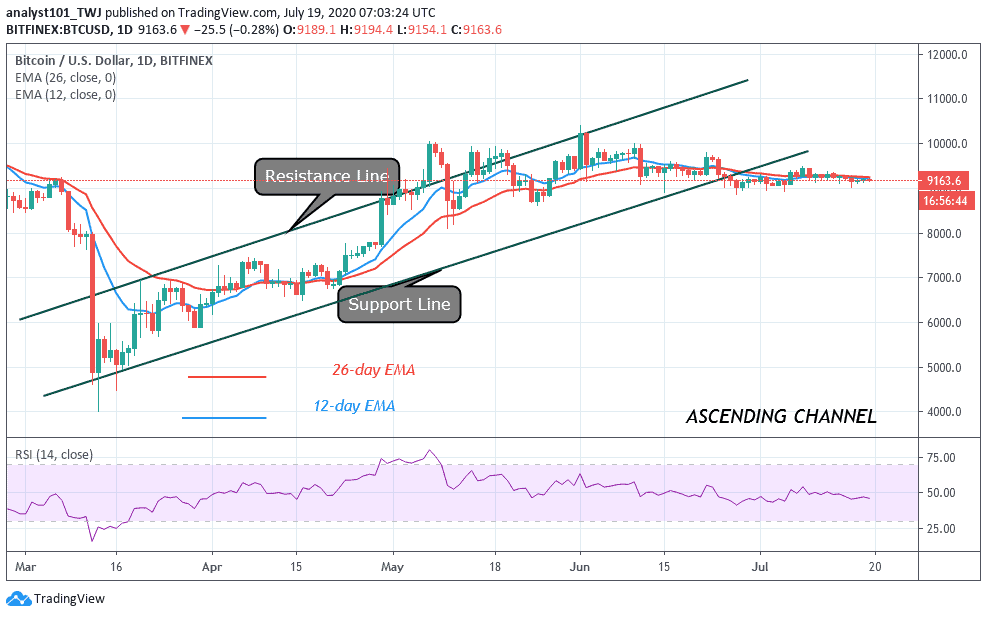
BTC/USD Long-term Trend: Ranging (Daily Chart)
Key levels:
Resistance Levels: $9,600, $9,800, $10,000
Support Levels: $8,800, $8,600, $8,400

BTC/USD is still struggling to maintain its position above $9,200 as its price saw another dive towards the $9,100 mark today. The coin may be in a dangerous position as the price slipped below the critical supports. Should the breakthrough be confirmed, the downside momentum may gain traction with the next focus on $8,900. At the time of writing, Bitcoin is trading below the 9-day and 21-day moving averages at $9,168.81.
Going by the chart patterns, BTC price dropped to $9,110 low today and corrected upward to reach the $9,213 resistance. After the retest at the $9,213 resistance, BTC/USD resumed another downward move. However, if the $9,000 and $9,100 support holds, the coin may continue its sideways movement above $9,100 support. More so, the number 1 crypto is above 45% range of the daily RSI which indicates that the market is in bullish momentum.
However, should BTC price failed to move above the moving averages; we may see a price cut to below the channel. A further low drive could send the price to $8,800, $8,600, and $8,400 support levels while the resistance levels to watch are $9,600, $9,800, and $10,000 respectively.
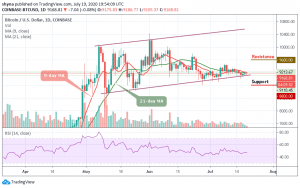
BTC/USD Medium – Term Trend: Bearish (4H Chart)
Looking at the 4-hour chart, the Bitcoin bulls have a partial breaking above the 9-day and 21-day moving averages. That is, the price is yet to break the upper trend line of the channel so that is why the upward movement could not be sustained. Ideally, if the price breaks the trend line and closes above it, the market price may continue to rise.

Meanwhile, if this possible, traders may expect a retest at $9,200 resistance level above the channel, and breaking this level may further allow the bulls to reach $9,250 and above. Any bearish movement below the moving averages may touch the critical support at $9,100 and below. The RSI (14) is moving around 51-level which indicates that the market is moving sideways.
Join Our Telegram channel to stay up to date on breaking news coverage