Join Our Telegram channel to stay up to date on breaking news coverage
Bitcoin Price Prediction – April 11
The market trading zone of $60,000 has been marked as a very tough resistance line that the BTC/USD value has continued to find difficult to break past northwardly over time. As of writing, price still struggles to trade around the zone mentioned earlier.
BTC/USD Market
Key Levels:
Resistance levels: $65,000, $70,000, $75,000,
Support levels: $50,000, $45,000, $40,000
BTC/USD – Daily Chart
The BTC/USD daily trading chart has it that a strong belief will favor the witness of more ups than downs in the next sessions. As price strives to continue to test and consolidate around the main resistance line of $60,000, the north direction is highly potential to occur after a while. The 50-day SMA indicator is keeping a distance away below both the bullish and the 14-day SMA trendlines. The Stochastic Oscillators have slantingly moved from the overbought region to now cross the hairs between ranges 80 and 40 to the north. That gives an expectation of seeing more ups.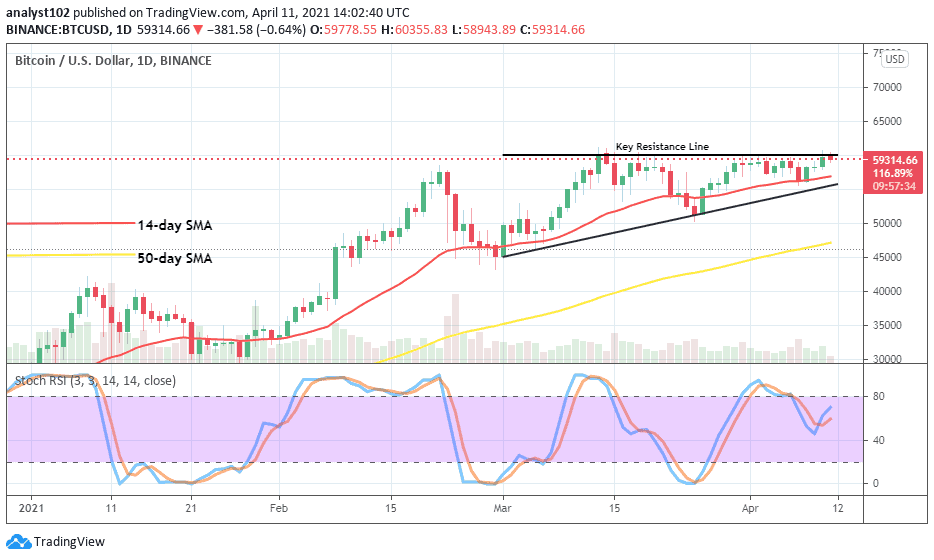
Will the $60,000 resistance level remain tough to be breached northwardly?
The level of the $60,000 trading zone has formed to denote a vital line for the BTC/USD bulls to breach to the north quite a while. The crypto’s value while trying to move past the level has always encountered resistance making it ugly to achieve a good stride away from the point until the present. Therefore, the current trading situation has made it necessary to await a more forceful price action to occur to have a distinct direction of the most valuable crypto trading market.
There has been no safe bearish signal to substantiate a good entry sell position in this particular trading currency pair. However, it will be coming after a sudden breakout of the resistance zone while price gets a reverse but, not during a volatile breakout course. Meanwhile, being as it is, the crypto tends to push around price to feature higher lows more in the next sessions.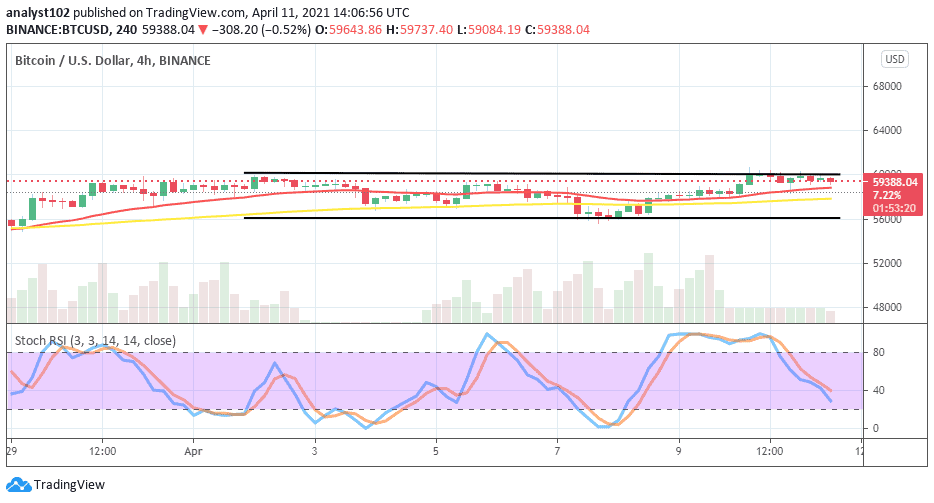
BTC/USD 4-hour Chart
Both the BTC/USD market movers in the medium-term run have been able to change the long-featuring range-bound trend since around some last trading days in March until the present. The range-bound trading zones remain as $60,000 and $56,000; being the upper and the lower range trading levels of the crypto-market. The two SMA trend lines are located in the range trend-lines as they flatly point towards the east direction to affirm the ongoing range moves of the trade. The Stochastic Oscillators slantingly moved from the overbought region to get placed at range 40. They still weakly point to the south and, could mean that price may a bit still come down for a test of support towards the $56,000 lower range line before the return of an upswing.
Join Our Telegram channel to stay up to date on breaking news coverage