

Join Our Telegram channel to stay up to date on breaking news coverage
Bitcoin (BTC) Price Prediction – July 27
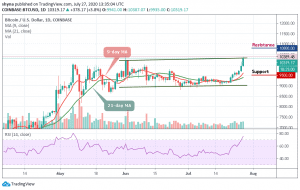
The leading cryptocurrency Bitcoin surged over $10,000 mark on early Sunday as the price went as high as $10,319 at the time of writing.
BTC/USD Long-term Trend: Ranging (Daily Chart)
Key levels:
Resistance Levels: $10,800, $11,000, $11,200
Support Levels: $9,500, $9,300, $9,100
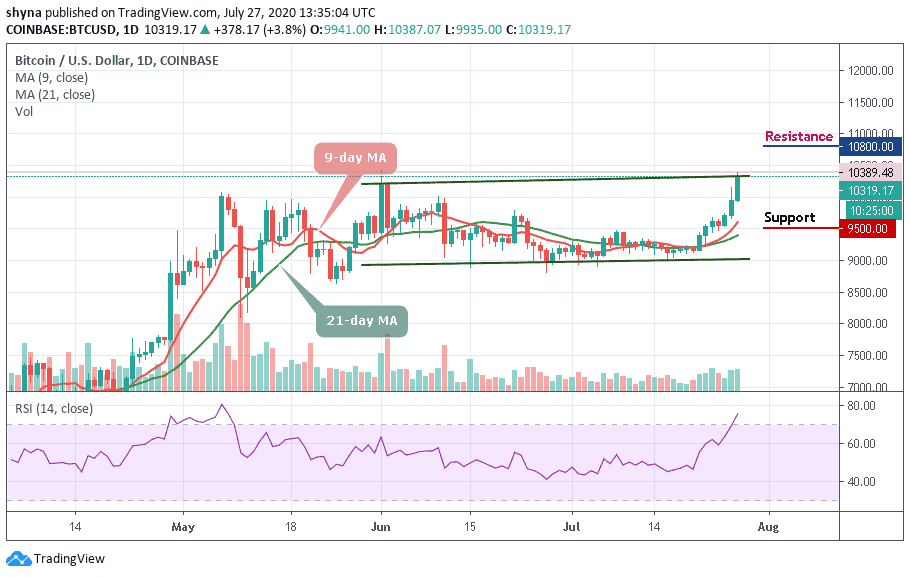
At the time of writing, BTC/USD is back to trading above $10,000 following a bounce from the opening value of $9,932. The trend is mainly bullish amid expanding volatility. Technically, Bitcoin is in the hands of the bulls. The technical indicator RSI (14), for instance, is holding above 75-level. Meanwhile, as the signal line is already within the overbought, the indicator is not showing any signs of a reversal.
However, gains are likely to continue, in the meantime, stabling support above $10,000 is key for the price action targeting $10,000. On the bearish side, it is important for BTC/USD to hold the support of $9,700, otherwise, there can come a bearish breakdown when BTCUSD falls below that barrier. Meanwhile, a strong bullish spike above $10,500 level may likely take the price to the potential resistance levels of $10,800, $11,000, and $11,200.
In other words, if the market decides to follow the downward trend, the Bitcoin price may likely drop to the nearest support at $9,800, and should this support fails to contain sell-off, the market may experience another drop to the critical supports of $9,500, $9,300, and $9,100.
BTC/USD Medium-Term Trend: Bullish (4H Chart)
According to the 4-hour chart, we have seen the upward movement which was quite notable on the structural outlook. Bitcoin trading is steady at $10,300 as the crypto-asset is overbought at the moment. Meanwhile, a potential fall is around the corner.
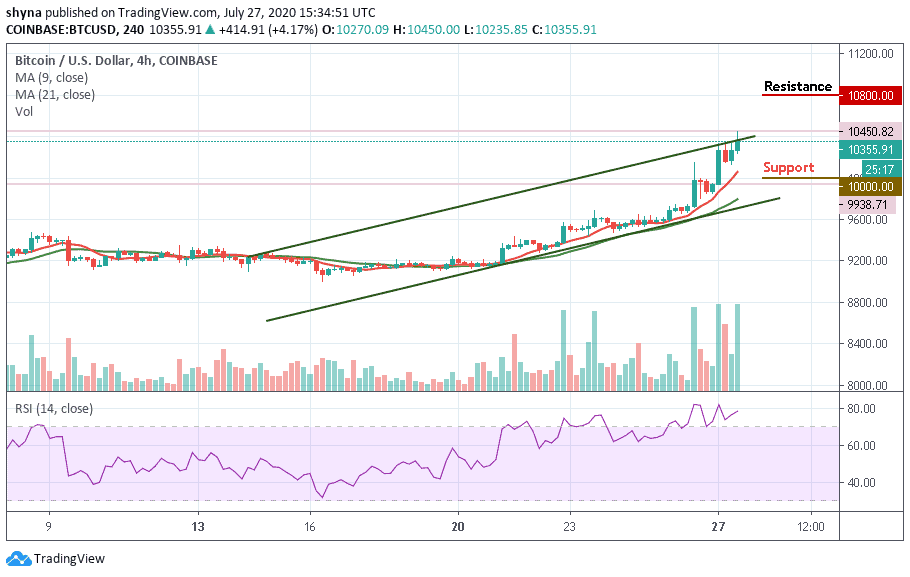
On the upside, further bullish movement may continue to meet resistance at around the $10,800 and $11,000. As of now, the technical indicator RSI (14) is reflected in the positive zone, not yet turning downward. But when this happens, BTC/USD may be looking for close support. A significant cross below the 70-level may send the market in a bearish scenario and the nearest supports lie at $10,000 and below.
Join Our Telegram channel to stay up to date on breaking news coverage
