Join Our Telegram channel to stay up to date on breaking news coverage
Bitcoin (BTC) Price Prediction – July 30
The Bitcoin (BTC) moves below $11,000 as the technical correction is gaining traction.
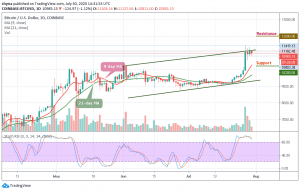
BTC/USD Long-term Trend: Bullish (Daily Chart)
Key levels:
Resistance Levels: $12,000, $12,200, $12,400
Support Levels: $10,200, $10,000, $9,800

BTC/USD is seen following a downtrend retreating below $11,000. In the early trading session, the first crypto attempted a recovery above $11,100, but the upside momentum faded away. At the time of writing this article, BTC/USD is hovering at $10,985, mostly unchanged both on a day-to-day basis and down 1.12% since the beginning of today.
Moreover, if the market decides to go down, the market price may drop to $10,800, and should this support fails to contain sell-off, traders may see a further drop to $10,200, $10,000, and critically $8,800. The resistance levels to watch are $12,000, $12,200, and $12,400 respectively. Meanwhile, the technical indicator RSI (14) is moving in the same direction within the overbought zone with an indication of indecisiveness in the market.
However, should there be resistance at $11,000, if the price manages to stay above it, then can say that the market is ready for another bull-run? So, $11,500 is the level in which BTC price wants to get stable so that it can discover the upward drive to the potential resistance levels of $12,000, $12,200, and $12,400.
BTC/USD Medium-Term Trend: Ranging (4H Chart)
BTC/USD is trading within the range of $10,750 to $11,354. Nevertheless, Bitcoin has not yet slipped below $10,700 and is still in the loop of making a bounce back. BTC price hovers around $11,981 and may take time to persistently trade above $11,300. The upward movement may be facing hurdles near the $11,500 and $11,700 resistance level.
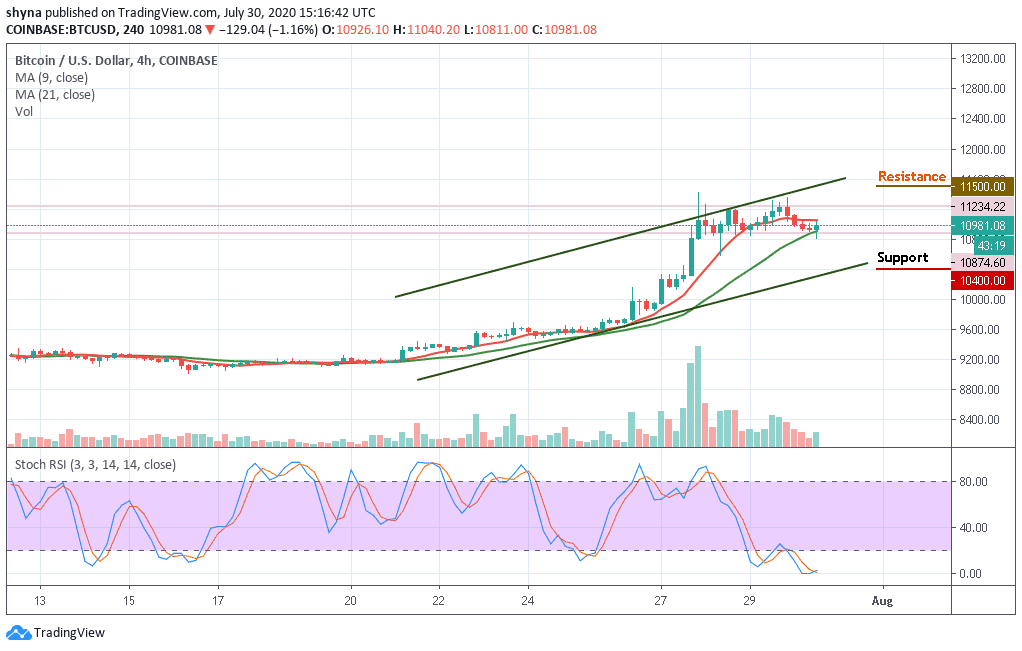
However, on the downside, immediate support is near the $10,600 level while the main support is at the $10,500 level. The price might slide sharply below $10,400 which may likely test another support at $10,200 level. Technically, Bitcoin is poised for more losses in the near-term as the stochastic RSI remains within the overbought, indicating a reversal for the bearish movement.
Join Our Telegram channel to stay up to date on breaking news coverage