Join Our Telegram channel to stay up to date on breaking news coverage
Bitcoin (BTC) Price Prediction – February 15
Two days ago, following the $10,000 break, BTC/USD was seen rising a bit more but getting rejected before the next critical resistance price level at $10,300 – $10,400.
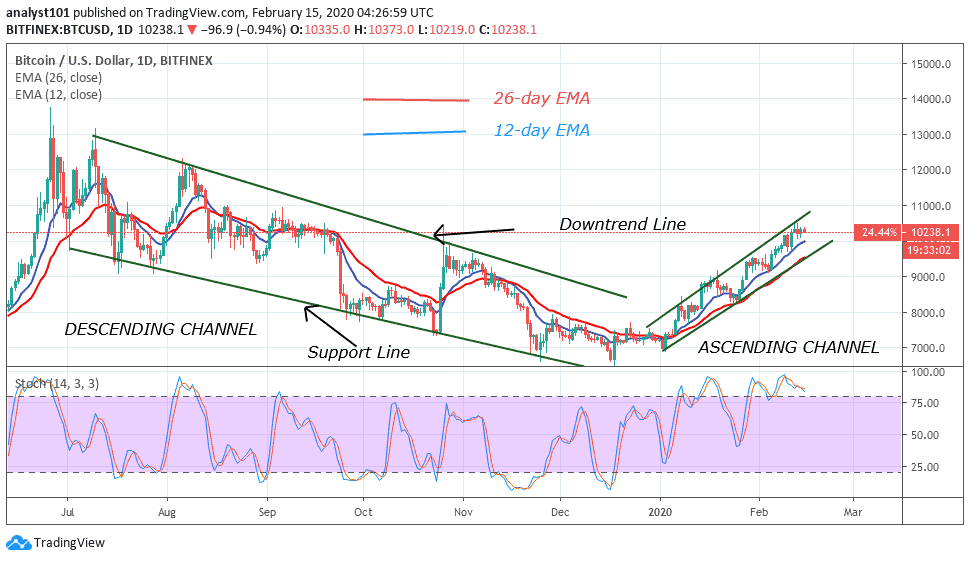
BTC/USD Long-term Trend: Bullish (Daily Chart)
Key levels:
Resistance Levels: $11,150, $11,350, $11,550
Support Levels: $9,450, $9,250, $9,050

BTC/USD has started to show signs of weakness at $10,400 as it continued to fail to make any ground above the resistance. It has dropped by a total of 1.28% within the 24 hours of trading as it drops into $10,238. Taking a look at the chart above, we can clearly see the Bitcoin Bull Run in full effect. After all, the cryptocurrency started the year at a price of around $7,235 and has managed to climb as high as $10,518 during this month.
However, we can see that Bitcoin is developing some signs of weakness at the $10,406 level. This resistance is provided by the 9-day moving average at $10,108 and BTC/USD continues to fail each time it attempts to break, and close, above the aforementioned level. The market still remains bullish as the signal lines of MACD are still at the positive side and it would need to drop beneath $9,500 for this Bull Run to be invalidated.
On the other hand, Bitcoin (BTC) must break the $10,430 resistance soon to remain in a bullish trading condition. If the sellers push it beneath the support at $10,000, the next level of support lies at $9,800. Beneath this, additional support lies at $9,450, $9,250 and $9,050 levels. In other words, if the bulls regroup and push higher, the first 2 levels of resistance lie at $10,500 and $10,700. Above this, the potential resistance lies at, $11,150, $11,350, and $11,550.
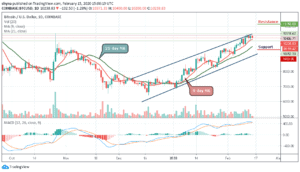
BTC/USD Medium – Term Trend: Ranging (4H Chart)
BTC/USD trades within the range of $10,110 to $10,420. Nevertheless, Bitcoin has not yet slipped below $10,200 and is still in the loop of making a bounce back. BTC price hovers around $10,240 and may take time to persistently trade above $10,400. The upward movement is facing hurdles near the $10,500 and $10,700 resistance level.

On the downside, immediate support is near the $10,150 level while the main support is at the $10,000 level. The price might slide sharply below $9,800 which may likely test another support at $9,600 level. Technically, Bitcoin is currently moving in sideways while the RSI (14) moves around 51-level, indicating indecisive market movement.
Please note: Insidebitcoins.com is not a financial advisor. Do your research before investing your funds in any financial asset or presented product or event. We are not responsible for your investing results.
Join Our Telegram channel to stay up to date on breaking news coverage