Join Our Telegram channel to stay up to date on breaking news coverage
Bitcoin (BTC) Price Prediction – December 2
The sells-off has resumed as Bitcoin price faces a fresh round of selling below $7,300 against the US Dollar.
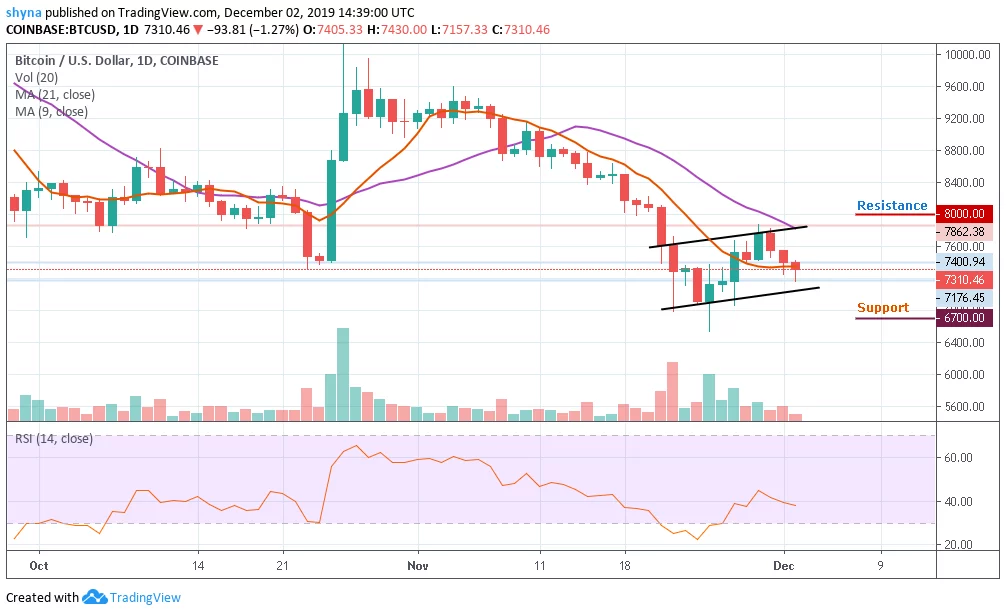
BTC/USD Long-term Trend: Bullish (Daily Chart)
Key levels:
Resistance Levels: $8,000, $8,500, $9,000
Support Levels: $6,700, $6, 200, $5,700

After an erratic recovery during the previous week, Bitcoin (BTC) resumed back into a selling mode. A few weeks ago, the coin topped at $7,862.38 and has been in retreat ever since. At the time of writing, BTC/USD is trading at $7,310, down 1.27% since the beginning of today. Bitcoin continues to narrow down towards $6,000. The downtrend is clearly shown by taking a broader technical picture using the daily chart.
Moreover, the BTC/USD price is struggling to hold a couple of important supports near $7,200. The price is likely to continue lower below the $7,000 and $6,800 support level. If there is a downside break below the $6,800 support level, the price could revisit the $6,700 support level. The bears are gaining momentum and if the price clears the $6,700 support, there is a risk of a sharp decline to $6,200 and $5,700 support levels.
In addition, the market is deciding around the 9-day moving average, where the buyers are anticipating a rebound. Meanwhile, the $7,600 and $7,800 levels may further surface as critical resistances should the $7,400 level holds. However, a strong bullish spike might take the price to $8,000, $8,500 and $9,000 levels. But presently, the RSI (14) is below the 40-level.
BTC/USD Medium – Term Trend: Bearish (4H Chart)
Looking at the 4-Hour chart, Bitcoin (BTC) has not yet slipped below $7,000 and is still in the loop of making a bounce back. BTC/USD price hovers below the 9-day and 21-day moving averages and may take time to persistently touch the resistance level of $7,500. At the moment, the Bitcoin price is currently moving around $7,302 level.
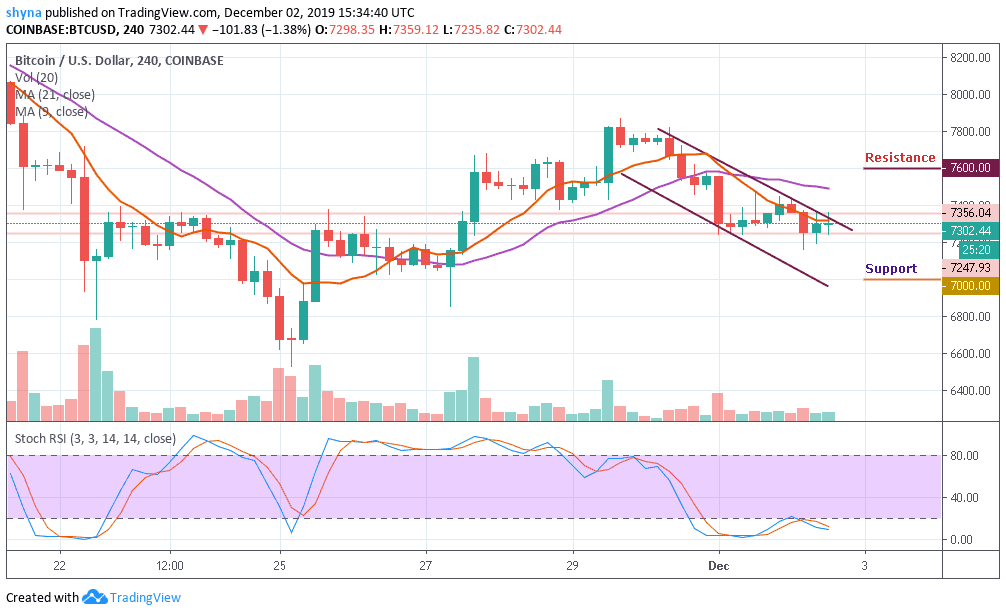
More so, if buyers can put more effort and energize the market, we can expect a retest of $7,500 resistance level. Therefore, breaking the mentioned resistance could also allow the bulls to test the $7,600, $7,800 and $8,000 upward. In other words, if the bears hold the price and push it downward, then the support level of $7,000, $6,800 and $6,600 may be visited as the stochastic RSI is within the oversold zone.
Please note: Insidebitcoins.com is not a financial advisor. Do your research before investing your funds in any financial asset or presented product or event. We are not responsible for your investing results.
Join Our Telegram channel to stay up to date on breaking news coverage