

Join Our Telegram channel to stay up to date on breaking news coverage
Bitcoin (BTC) Price Prediction – April 6
Looking at the daily chart, the Bitcoin price is trading in positive territory, up 4.85% in the second half of the session.
BTC/USD Long-term Trend: Bullish (Daily Chart)
Key levels:
Resistance Levels: $8,000, $8,200, $8,400
Support Levels: $6,000, $5,800, $5,600
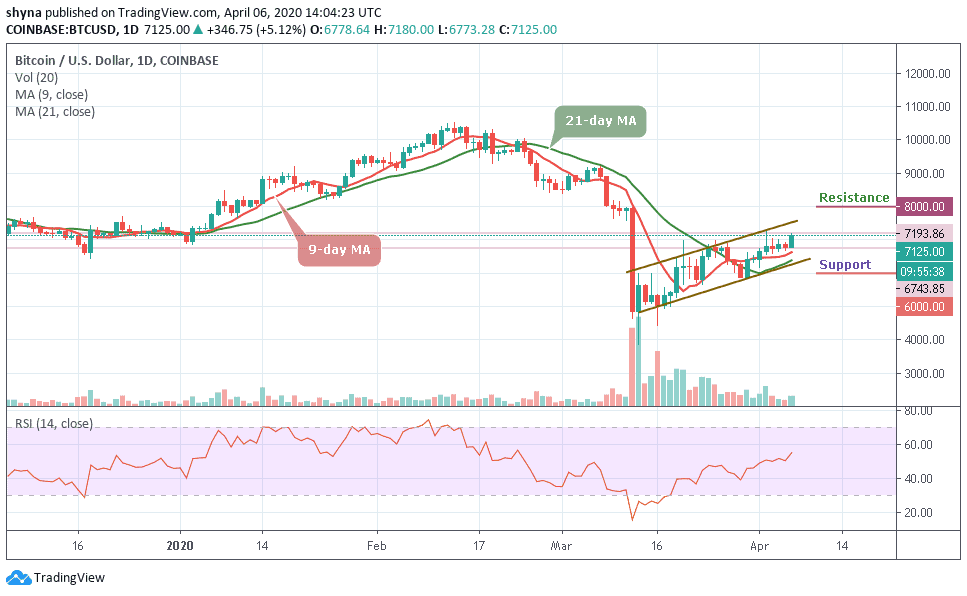
The daily chart reveals that BTC/USD broke free from the recent range and the upside momentum is gaining traction. Now that BTC/USD settled above $7,000, crypto bulls set their eyes at $7,500, which is the next critical resistance for the first digital coin. According to the technical indicator RSI (14), BTC/USD is currently in the hands of the bulls.
Currently, the market price for BTC/USD and the daily candle is trading at $7,125 but if the bulls could successfully push the price above the channel, the next resistance levels may be found at $8,000, $8,200 and $8,400. Typically when the new uptrends are beginning to form, traders may use both the 9-day and 21-day moving averages as the nearest support level.
However, any failure by the bulls to move the price up, we may see a price cut to $6,500 vital support. A further low drive could send the price to $6,000, $5,800 and $5,600 supports. For now, the bulls are still dominating the market. But as things stand, the BTC/USD price may continue to follow the upward trend because the RSI (14) focuses on the north.
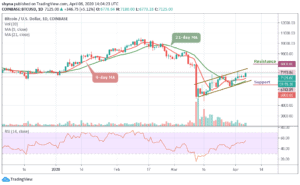
BTC/USD Medium-Term Trend: Bullish (4H Chart)
Looking at the 4-hour chart, the bears wanted to step back into the market by bringing the price from $7,183 to $7,054, but the bulls quickly held the support by picking the price from there to where it is currently trading at $7,089 which is above the 9-day and 21-day moving averages. Meanwhile, the $7,500 and above may come into play if BTC/USD breaks above the channel.

However, if the price breaks below the moving averages of the ascending channel and begins to fall, the support levels of $6,700 and below may be in focus. Meanwhile, as the technical indicator RSI (14) moves around 70-level, more bullish signals may play out before a reversal could come in.
Please note: Insidebitcoins.com is not a financial advisor. Do your research before investing your funds in any financial asset or presented product or event. We are not responsible for your investing results.
Join Our Telegram channel to stay up to date on breaking news coverage
