Join Our Telegram channel to stay up to date on breaking news coverage
Bitcoin (BTC) Price Prediction – June 22
Bitcoin price lags breakout above the previous support levels and likely to blast it above $9,800.
BTC/USD Long-term Trend: Bullish (Daily Chart)
Key levels:
Resistance Levels: $10,500, $10,700, 109,900
Support Levels: $8,500, $8,300, $8,100
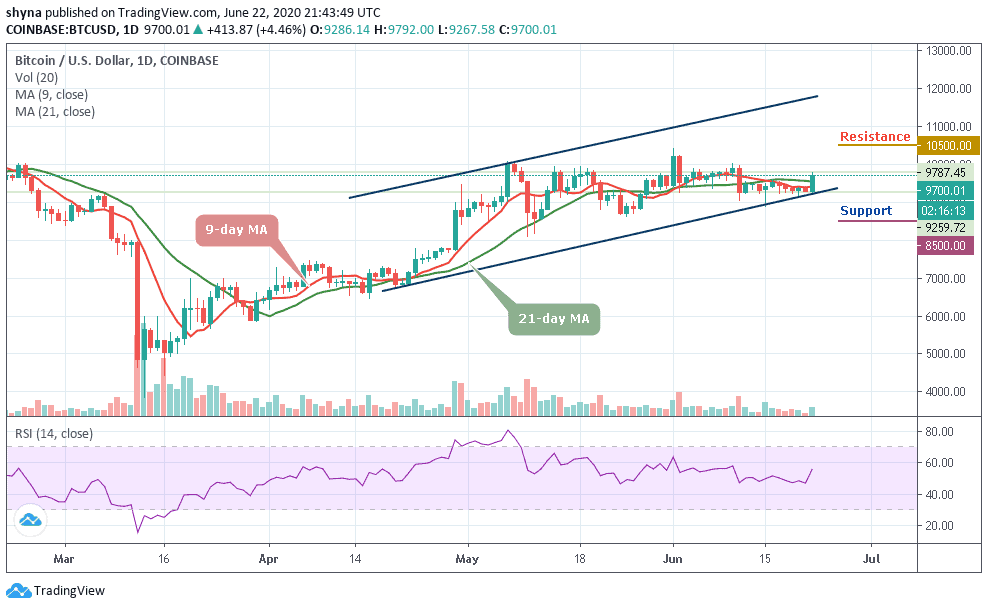
BTC/USD is back with a bang as it kick-starts the new week on a positive note touching the daily high of $9,787 resistance level. Before the coin could close yesterday, it has initiated a downtrend after it found a support level below $9,400. Today, the price of Bitcoin is rebounding and it has already formed a few higher highs while tracing a bullish trend line.
However, the market is currently trading above the 9-day and 21-day moving averages, where the buyers are anticipating for more breakout into the higher level. Meanwhile, the $9,800 and $9,900 levels may further surface as the key resistances should the $9,700 level holds. However, a strong bullish spike may take the price to $10,500, $10,700, and $10,900 levels.
Moreover, if the market makes a quick turn to the south, the BTC/USD price may likely drop below the lower boundary of the channel and should this barrier fails to contain the sell-off, traders may see a further roll back to $8,500, $8,300, and critically $8,100. The RSI (14) suggests an upward movement for the coin as the signal line moves above the 55-level.
BTC/USD Medium – Term Trend: Bullish (4H Chart)
The 4-hour chart reveals that the price of Bitcoin (BTC) is currently trading around $9,673 and well-above the 9-day and 21-day moving averages after a reversal from $9,264 that occurred in the early hours of today’s trading. However, the 4-hour chart shows that the bullish supply is becoming heavy in the market while the bears are also trying to bring the price down.
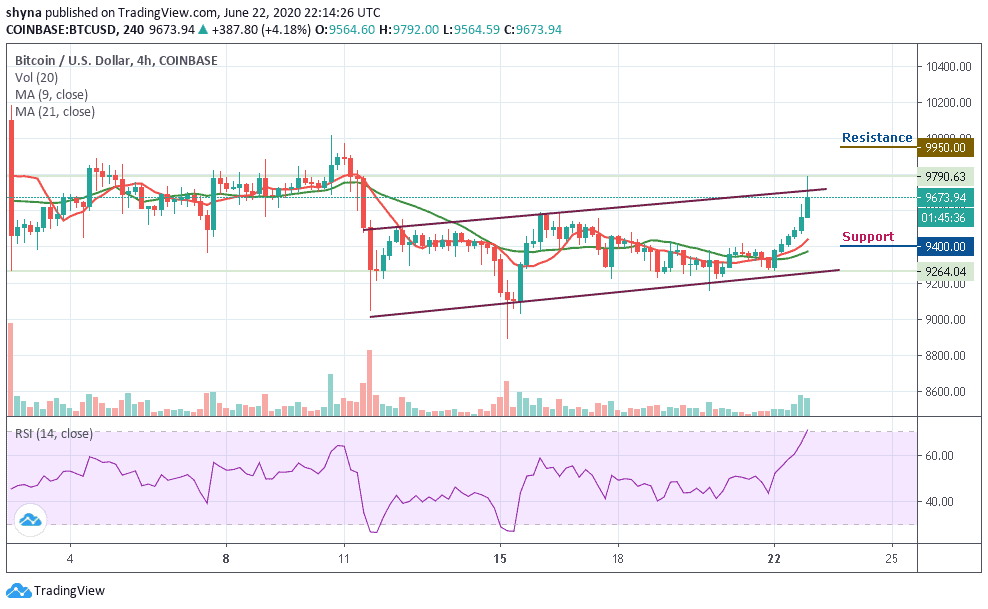
However, if the buyers could put more effort and energize the market, they can further push the price to a $9,800 resistance level. Therefore, breaking the mentioned resistance may likely allow the bulls to test the $9,950 and above. In other words, the RSI (14) is currently moving into the overbought zone, but when it turns down; the bears could step back into the market and bring the price to the support level of $9,400 and below.
Join Our Telegram channel to stay up to date on breaking news coverage