Join Our Telegram channel to stay up to date on breaking news coverage
Bitcoin (BTC) Price Prediction – November 27
The Bitcoin price is booking a loss with its daily movement as the price faces rejection at $7,155.
BTC/USD Long-term Trend: Bearish (Daily Chart)
Key levels:
Resistance Levels: $8,000, $8,500, $9,000
Support Levels: $6,200, $5, 700, $5,200
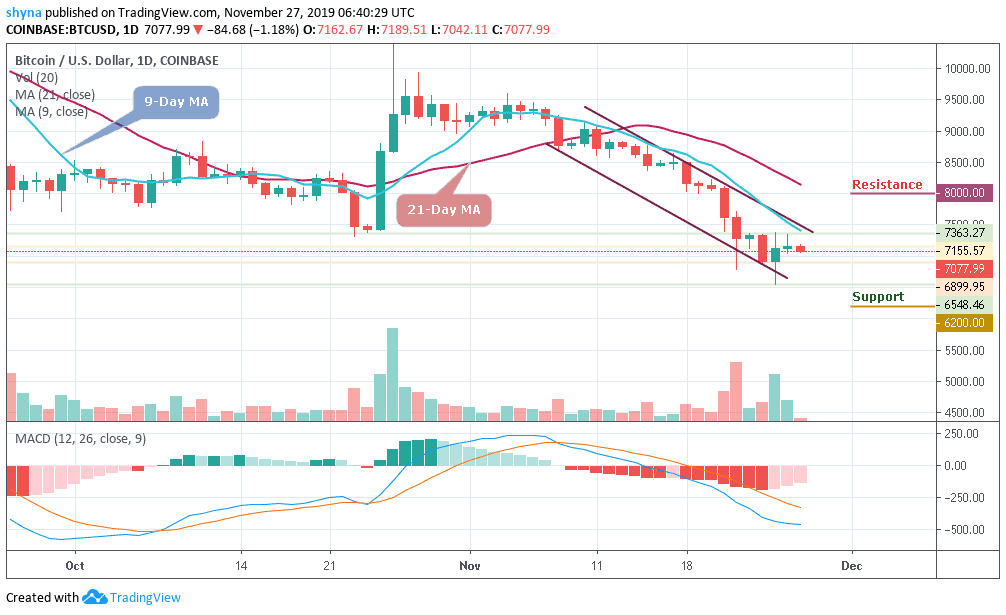
During the Asian session today, it can be easily seen that the market is back in the red zone as BTC/USD is posting minor losses of 1.35% on the day after commencing the trading at $7,155. It has an intraday high of $7,171, although the world’s largest crypto is moving towards the support level of $7,000. The on-going trend is bearish according to the cryptocurrency live rates amid high volatility.
However, Bitcoin just plunged below $7,300 one more time, marking $7,077 as the current daily low at the moment. Does this mean that Bitcoin (BTC) is finally leaving the significant $7,300 support level and searching for a new low? Nevertheless, mere looking at the declining daily volume candle, together with the steady but stable recent Bitcoin price action, it can be assumed that a stronger move may be coming up soon into the market.
Moreover, as at the time of writing this article, BTC/USD is struggling to maintain the $7,000 support level and if the coin follows the downward trend, the next supports may likely come at $6,200, $5,700 and $5,200. From the upside, by maintaining the current level $7,077 could send the coin to retest old support turned resistance levels at $7,363. The further movement could go above the upper boundary of the descending channel and the significant 9-day MA to send the price to the resistance levels of $8,000, $8,500 and $9,000 which will be well above the 21-day MA.
The MACD is playing in the negative zone, indicating that the market is revealed in a bearish condition on the daily chart.
BTC/USD Medium – Term Trend: Ranging (4H Chart)
BTC/USD trades within the range of $7,265 to $7,075. Nevertheless, Bitcoin has not yet slipped below $7,000 and is still in the loop of making a bounce back. BTC/USD price hovers around the 9-day and 21-day MA and may take time to persistently trade above the moving averages. At the moment, the Bitcoin price is currently moving around $7,095 level. The upward movement is facing hurdles near the $7,400 and $7,600 resistance level.
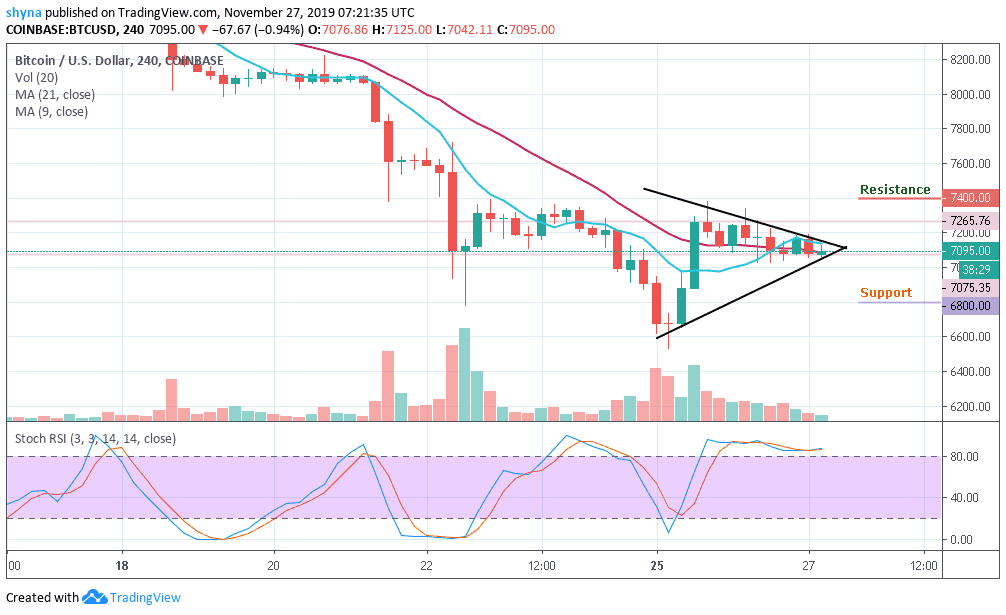
Furthermore, on the downside, immediate support is near the $7,000 level while the main support is at the $6,800 level. The price might slide sharply below $6,400 which may likely test the main support at $6,200 level. Technically, Bitcoin is poised for more losses in the near-term as stochastic RSI is currently moving within the overbought zone, which may soon be giving some bearish signals.
Please note: Insidebitcoins.com is not a financial advisor. Do your research before investing your funds in any financial asset or presented product or event. We are not responsible for your investing results.
Join Our Telegram channel to stay up to date on breaking news coverage