Join Our Telegram channel to stay up to date on breaking news coverage
Bitcoin (BTC) Price Prediction – May 14
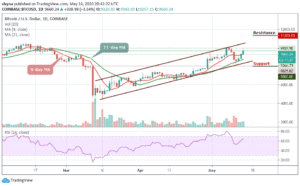
The Bitcoin price steps above $9,500 to confirm a return of the bulls into the market after recovery from the low of last week.
BTC/USD Long-term Trend: Bullish (Daily Chart)
Key levels:
Resistance Levels: $11,300, $11,500, $11,700
Support Levels: $8,000, $7,800, $7,600

BTC/USD has been following a bullish trend several days after the halving process as traders are expecting a massive price action after the halving. The Bitcoin (BTC) decides to take a slow approach; first stepping into the $9,000’s range and then breaking above the resistance level of $9,500 today. At the time of writing, Bitcoin is trading at $9,660 after touching the daily high at $9,937.90, following a 3.64% growth on the day.
Moreover, the buyers have kept their eyes on the medium-term target at $10,000 since the opening at $9,266. The Bitcoin price is trading at $9,660 and breaking above this level confirms the bulls’ presence in the market. According to the RSI (14), BTC/USD is comfortable in the hands of the buyers as the indicator is renewing its movement towards the overbought condition. If the motion remains intact, more buying entries could eventually push the coin towards $10,000.
However, as far as support is concerned, $9,200 level is the short term support and if push comes to shove and a reversal ensues under $9,000, Bitcoin may seek supports at $8,000, $7,800, and $7,600. Meanwhile, any bullish movement above the ascending channel may likely reach the resistance levels of $11,300, $11,500, and $11,700 respectively.
BTC/USD Medium – Term Trend: Bullish (4H Chart)
On the 4-hour chart, BTC/USD needs to climb $10,000 above the upper boundary of the channel to mitigate the short-term bearish pressure and allow for an extended recovery towards $10,200. This psychological barrier may closely follow by $10,400 and $10,600 resistance levels.

In contrast, the nearest support is below the 9-day moving average at $9,400, and a sustainable move lower will increase the downside pressure and push the price towards $9,000 and $8,800 support levels. Considering that the stochastic RSI on the 4-hour chart is extremely within the overbought zone, traders might expect more bullish signals into the market.
Please note: Insidebitcoins.com is not a financial advisor. Do your research before investing your funds in any financial asset or presented product or event. We are not responsible for your investing results.
Join Our Telegram channel to stay up to date on breaking news coverage