Join Our Telegram channel to stay up to date on breaking news coverage
Bitcoin (BTC) Price Prediction – June 7, 2020
For the past four days, the market has continued to fluctuate above $9,400. Today, BTC/USD pair is trending upward, therefore, the upside range between $9,300 and $9,800 is likely to hold. However, if the market fails to hold in the $9,000 to $9,300 region, a further downward momentum is expected.
Key Levels:
Resistance Levels: $10,000, $11, 000, $12,000
Support Levels: $7,000, $6,000, $5,000

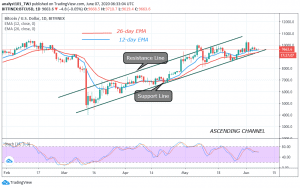
Bitcoin is trending upward indicating a possible continuation of the upside range. In the upside range, the market fluctuates between $9,300 and $9,800 to retest the $10,000 overhead resistance. Alternatively, a strong bounce above any of these levels can break the overhead resistance. On June 1, BTC rebounded above the $9,600 support to break the overhead resistance but buyers failed to sustain the momentum. Meanwhile, Bitcoin is gradually rising above the $9,600 as the market is marred by low volatility.
Nonetheless, as the upside range is progressing, we cannot rule out the fact that price can fall at any time. On the downside, if the price breaks below $9,300 support or BTC fails to hold in the $9,000 to $9,300 region; there is the tendency for a further downtrend. The market will drop to $8,800 and later to $8,500 support. The price will reach a low of $8,200 if the $8,500 support cracks. Meanwhile, BTC is below 60% range of the daily stochastic indicating a bearish momentum. This is contrary to the price action which indicates bullish signals.
BTC/USD Medium-term Trend: Bullish (4-Hour Chart)
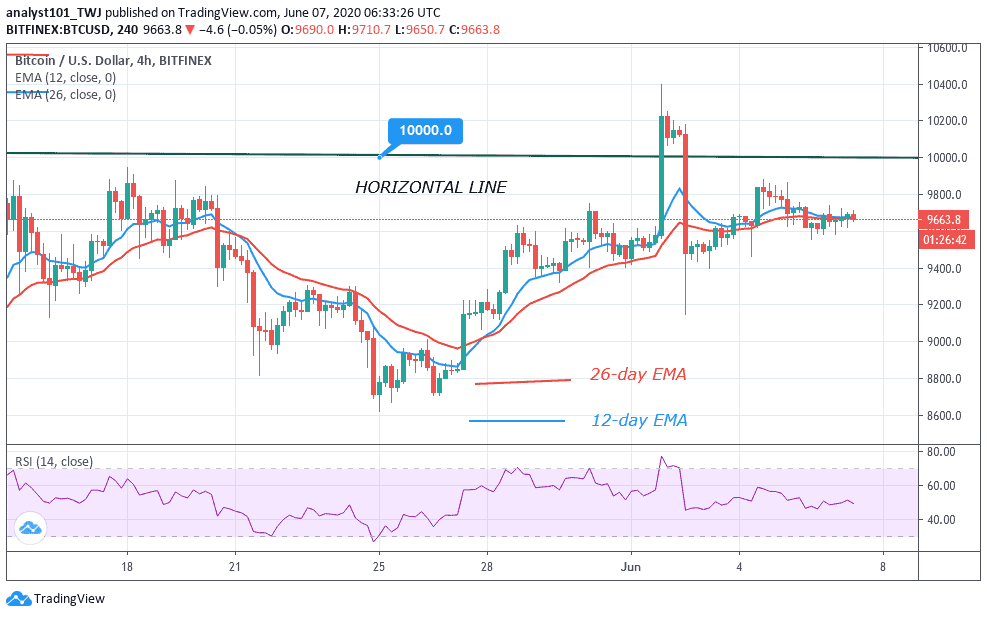
On the 4 hour chart, the price movement is insignificant as the market continues to consolidate above $9,500. At the moment, the price action is characterized by small body candlesticks. These are indecision candlesticks like Doji and Spinning tops describing the indecision between buyers and sellers about the direction of the market. Meanwhile, the market is still fluctuating. The Relative Strength Index period 14 is at level 50 indicating that price is approaching the uptrend zone.
Please note: Insidebitcoins.com is not a financial advisor. Do your research before investing your funds in any financial asset or presented product or event. We are not responsible for your investing results.
Join Our Telegram channel to stay up to date on breaking news coverage