Join Our Telegram channel to stay up to date on breaking news coverage
Bitcoin (BTC) Price Prediction – June 16, 2020
Yesterday, Bitcoin slumped to $8,914 low and corrected upward to $9,500 high. BTC/USD pair is now facing resistance at $9,500. The ability of the bulls to clear the $9,500 resistance will determine a fresh uptrend.
Key Levels:
Resistance Levels: $10,000, $11, 000, $12,000
Support Levels: $7,000, $6,000, $5,000
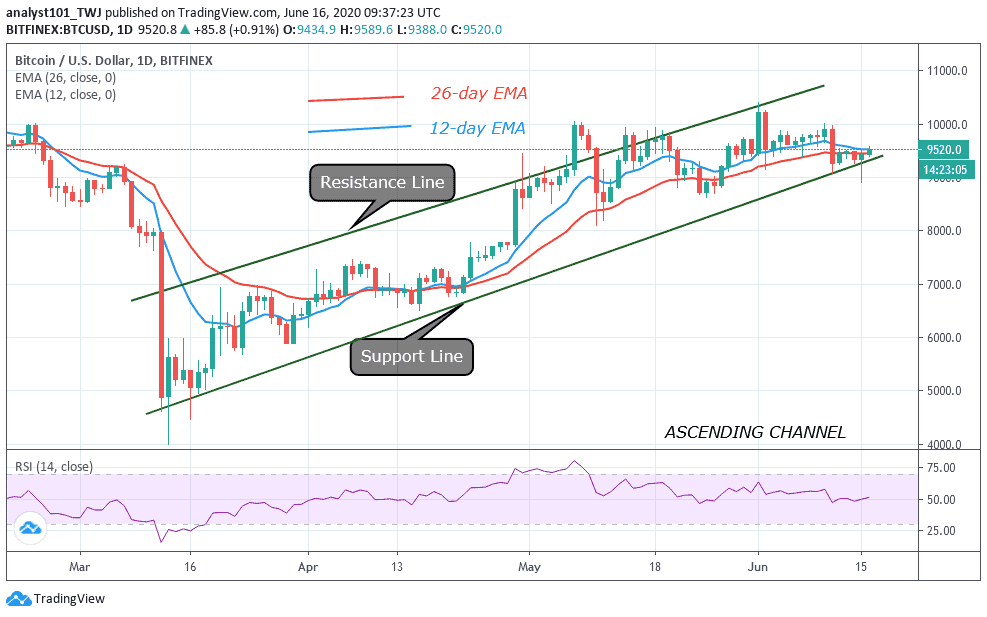
The king coin made positive moves yesterday as bulls pushed price through the $9,000 region. Today, the uptrend is contested by the bears as BTC faces the resistance at $9,500. The bottom line is that the bulls must clear the $9,500 resistance zone for the upside range trading to commence; otherwise, a decline below $9,300 will ensue. On the upside, if the bulls cleared the $9,500 resistance zone, the next resistance will be $9,640. A retest of the $10,000 overhead resistance becomes possible once the $9,800 resistance is overcome.
Conversely, if the bulls fail to clear the $9,500 resistance, there will be a bearish reaction. BTC will resume a downward move and decline below $9,300.The king coin will continue to the $9,200 and $9,100 price levels. However, when the bears break below $9,000, a new downtrend will resume. In the meantime, Bitcoin is trading at $9,503 at the time of writing. The Relative Strength Index period 14 is at level 51. This indicates that price is in the uptrend zone. The bulls are attempting to initiate a fresh uptrend.
BTC/USD Medium-term Trend: Bullish (4-Hour Chart)
On the 4 hour chart, Bitcoin was on a downward move after the resistance at $10,000. After the breakdown at the low of $8,914, a Doji candlestick is formed.
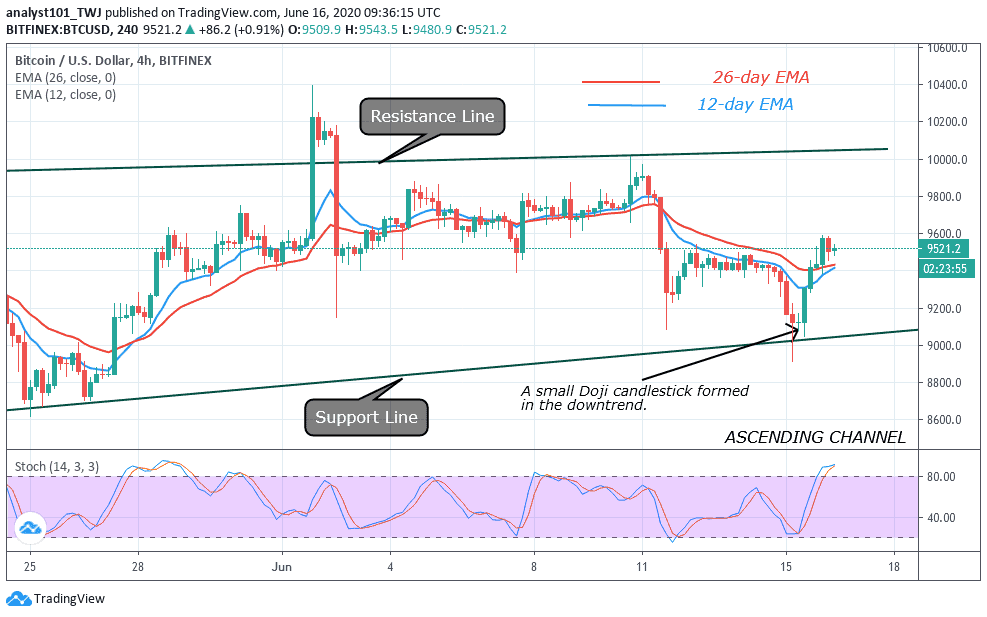
This Doji candlestick indicates that the current downtrend has ended. The current trend is likely to reverse. From the price action, the market has already moved up to resume the upside range trading. Secondly, Bitcoin is above 80 % range of the daily stochastic. It indicates that the coin has reached the overbought region of the market. And that those sellers are likely to emerge to push prices down. However, in a trending market, the overbought condition may not hold.
Please note: Insidebitcoins.com is not a financial advisor. Do your research before investing your funds in any financial asset or presented product or event. We are not responsible for your investing results.
Join Our Telegram channel to stay up to date on breaking news coverage