Join Our Telegram channel to stay up to date on breaking news coverage
Bitcoin (BTC) Price Prediction – June 18, 2020
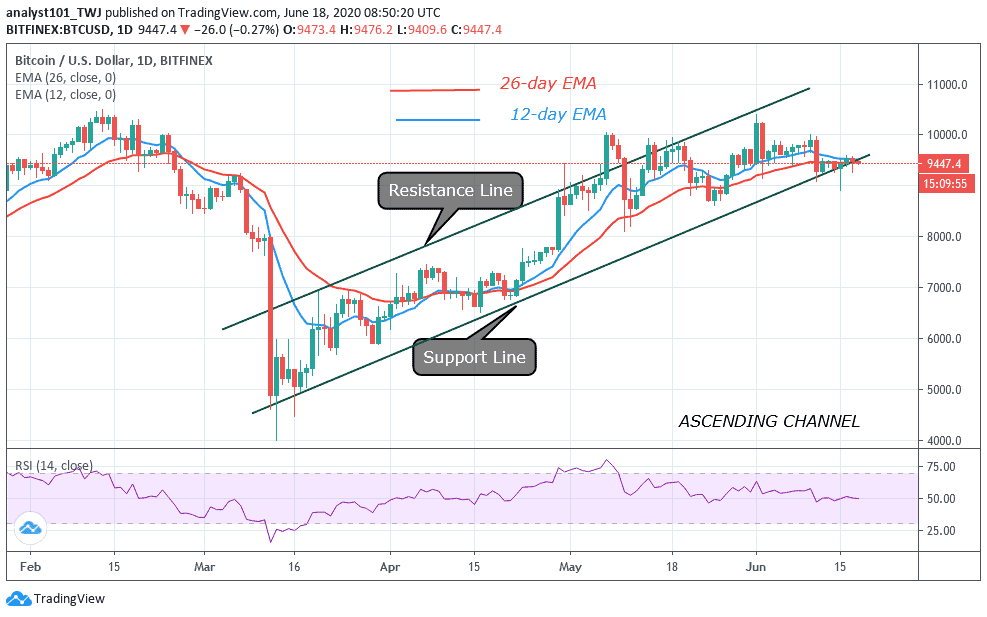
In the last 48 hours, BTC/USD pair has continued to hover above $9,400 support level. Yesterday, the market suddenly dropped to $9,300 but corrected upward. This indicates that the bulls and bears have reached equilibrium above the $9,400 support.
Key Levels:
Resistance Levels: $10,000, $11, 000, $12,000
Support Levels: $7,000, $6,000, $5,000
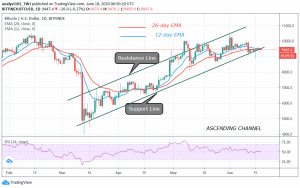
Following the recovering of the king coin from the $8,914 low to $9,400 high, the bulls have been able to sustain hold above the $9,400 support. The price corrected up to $9,580 and the momentum extended to $9,600 high. At the recent high, there was the presence of sellers. Nonetheless, buyers could not clear the $9,500 and $9,680 resistance zone. Later, BTC began a downward move. Nevertheless, the upside range will continue to hold as long as the $9,050 – $9,300 support holds.
Bitcoin will resume a downward move if the $9,050 – $9,300 support fails to hold. For instance, a break below $9,300 support will propel BTC to slump to $9,000. Eventually, if the $9,000 support cracks, the market will drop again to $8,910 support zone. However, if the downtrend extends to $8,130, buyers will keenly defend the current support insistently. The Relative Strength Index period 14 is at level 50. This indicates that price is in the uptrend zone. The bulls are still holding on at the upside range above $9,300.
BTC/USD Medium-term Trend: Bullish (4-Hour Chart)
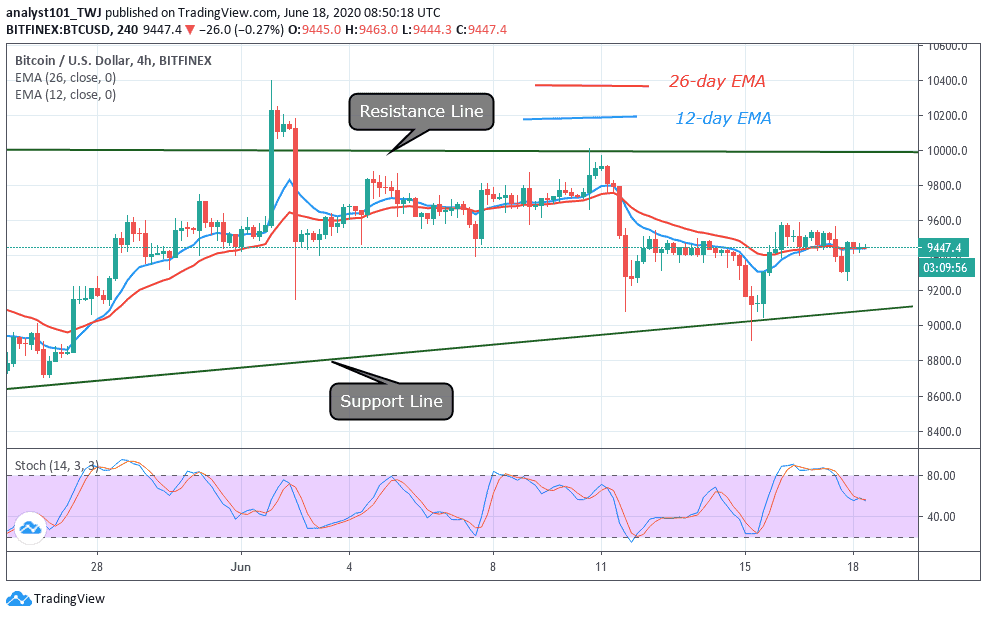
On the 4 hour chart, Bitcoin is consolidating above $9,400 as bulls fail to sustain the uptrend. Yesterday, the price suddenly dropped and pulled back. Today, the price action is displaying small body candlesticks which indicate that buyers and sellers are in a period of indecision about the market direction. The 12-day EMA and 26-day EMA are horizontally flat which indicates that BTC is consolidating. The king coin is above 50 % range of the daily stochastic. However, the stochastic bands are flat as the momentum remains stagnant.
Please note: Insidebitcoins.com is not a financial advisor. Do your research before investing your funds in any financial asset or presented product or event. We are not responsible for your investing results.
Join Our Telegram channel to stay up to date on breaking news coverage