Join Our Telegram channel to stay up to date on breaking news coverage
Bitcoin (BTC) Price Prediction – June 4, 2020
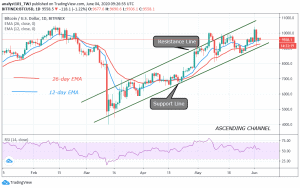
Since June 2, BTC/USD pair has been correcting upward but there has been no significant price movement. Price now fluctuates in the upside range between $9,300 and $9,800. The overhead resistance can be breached if $9,800 is first broken.
Key Levels:
Resistance Levels: $10,000, $11, 000, $12,000
Support Levels: $7,000, $6,000, $5,000
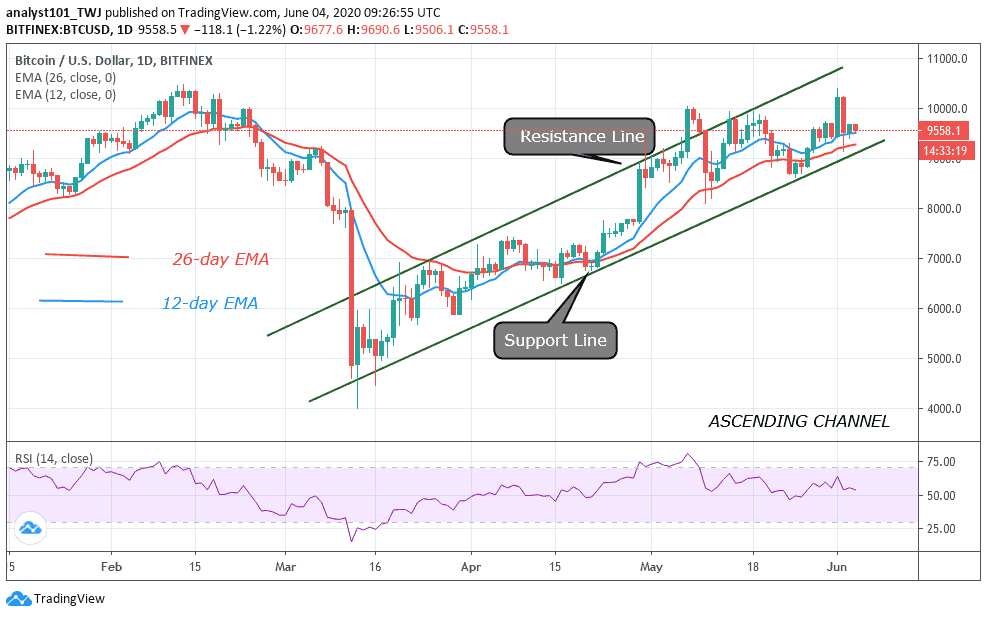
In the last 48 hours, price movement has been irrelevant as price moved from $9,500 to $9,600. The volatility is not there to push price upward in the upside range. In May, the upside range was functional as the market moves up and down consistently to retest the overhead resistance. In June, buyers are expected to buy the dips as we anticipate higher price levels in the future. Buyers are expected to push price above the $9,800 resistance so as to breach the overhead resistance at $10,000. The overhead resistance cannot be breached except the market beached the $9,800 resistance.
Nonetheless, if the bulls fail to break $9,800 in the upside range, the market will face a downward move to retest the $9,500 support. However, from the chart, a break below $9,500 will sink Bitcoin on the downward side. Bitcoin survived the previous breakdown as the $9,500 support was held. The bears may take undue advantage to break the current support if the bulls fail to break the $9,800 resistance. The Relative Strength Index period 14 has fallen to level 55 indicating that price is the uptrend zone.
BTC/USD Medium-term Trend: Bullish (4-Hour Chart)
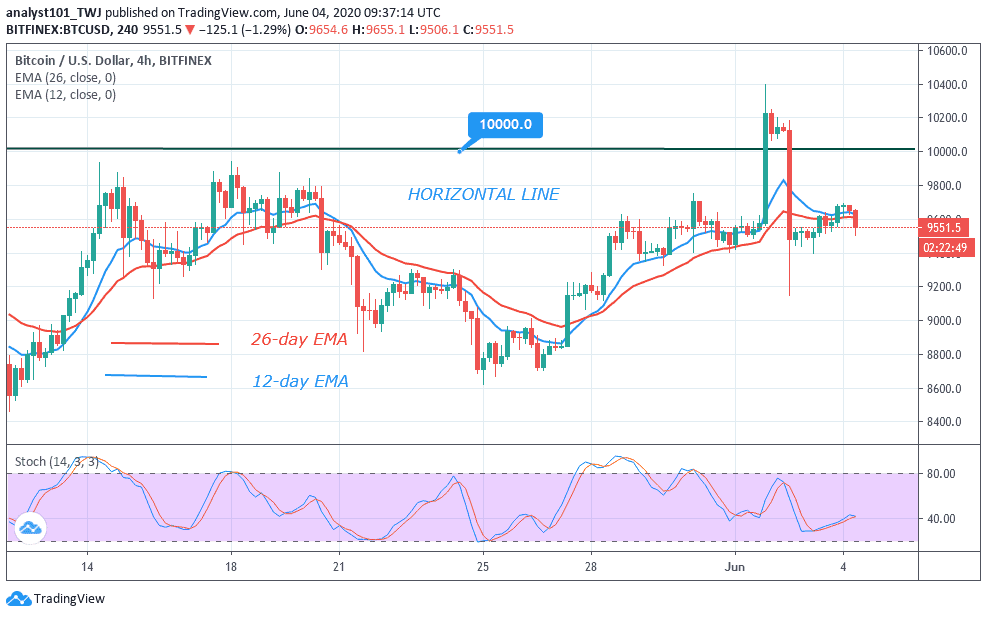
On the 4 hour chart, the market fell to $9,150 low and commenced an upward correction. First of all, the coin pulled above $9,500 and continued correction. BTC is currently facing resistance at $9,690. Sellers are likely to push price downward. On May 31, sellers push price to $9,400 low and BTC rebounded to break the overhead resistance. It is likely that the price action may repeat itself if the upward move is sustained. Meanwhile, BTC is above 40% range of the daily stochastic indicating a bullish momentum.
Please note: Insidebitcoins.com is not a financial advisor. Do your research before investing your funds in any financial asset or presented product or event. We are not responsible for your investing results.
Join Our Telegram channel to stay up to date on breaking news coverage