Join Our Telegram channel to stay up to date on breaking news coverage
Bitcoin (BTC) Price Prediction – June 23, 2020
Yesterday, the bulls clear the $9,500 and $9,680 resistance as BTC/USD pair resumed the upside range trading. The market also retested the $9,800 resistance. Unfortunately, BTC is retracing from the recent high of $9,800. Buyers would have retested the $10,000 overhead resistance if they have cleared the $9,800 and $9,860 resistance.
Key Levels:
Resistance Levels: $10,000, $11, 000, $12,000
Support Levels: $7,000, $6,000, $5,000
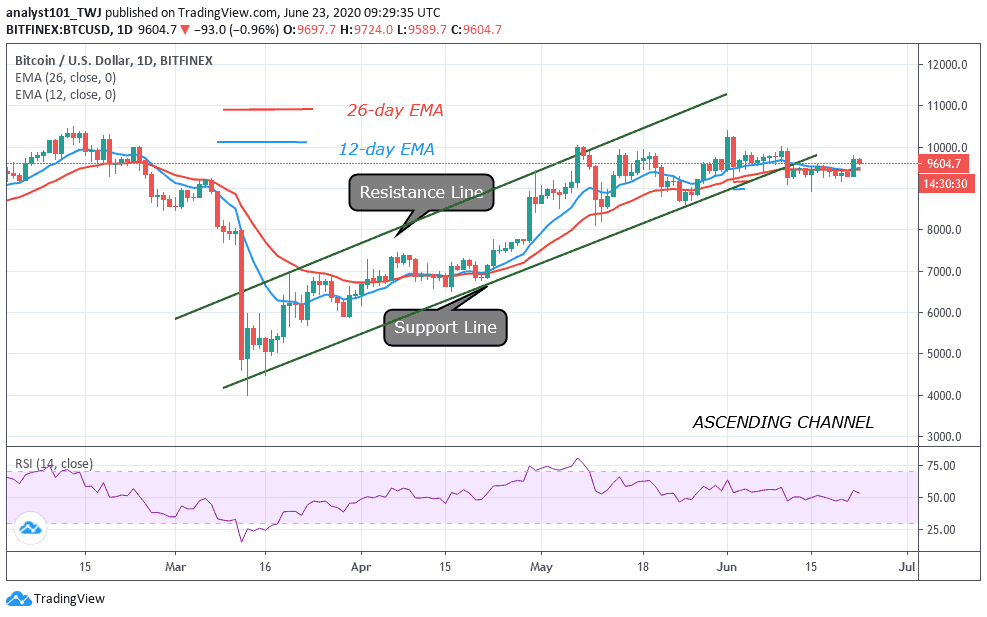
For over two weeks, the $9,000- $9,300 support has been holding as bulls broke the $9,500 and $9,680 resistance. Buyers’ next move is to break the resistance at $9,800 and $9,880. The bulls were resisted at the $9,800 high, causing the king coin to retrace. The $10,000 overhead resistance would have been retested if the upside range trading is successful. In the upside range trading, BTC will be fluctuating between $9,300 and $9,800 to retest the $10,000 overhead resistance. Nonetheless, the market is retracing to the support above $9,300 or $9,400.
Analysts believe that as long as price remains above $9,300 the upside range trading will continue. In other words, the bulls will continue to retest the $10,000 overhead resistance. Meanwhile, price has broken above the 12-day EMA and the 26-day EMA. It indicates that BTC will continue to rise. The Relative Strength Index period 14 is at level 54. The coin is still in the uptrend zone.
BTC/USD Medium-term Trend: Bullish (4-Hour Chart)
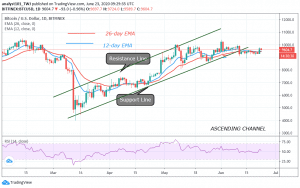
On the 4 hour chart, the bulls broke the downtrend line as price closed above it. The implication is that the price movement was accelerated on the upside.

The price rallied and reached a high of $9,800 but was resisted. The market is retracing and approaching the low of $9,300 or $9,400. The upside range trading between $9,300 and $9,800 will resume as soon as price finds support above $9,300. Bitcoin is below 80% range of the daily stochastic. Sellers emerge to push prices down. Presently, it is in a bearish momentum. This has been confirmed, as the price action indicates a bearish signal.
Join Our Telegram channel to stay up to date on breaking news coverage