Join Our Telegram channel to stay up to date on breaking news coverage
The Bitcoin price has given an ounce of hope to traders as they are now wondering how Bitcoin’s price will behave this week. Is BTC coming to the $25,400 target this week?
To understand the price graph of any cryptocurrency, one should always examine the situation more closely. So let us go ahead and do that.
Bitcoin Price Trend in The Last 7 Days
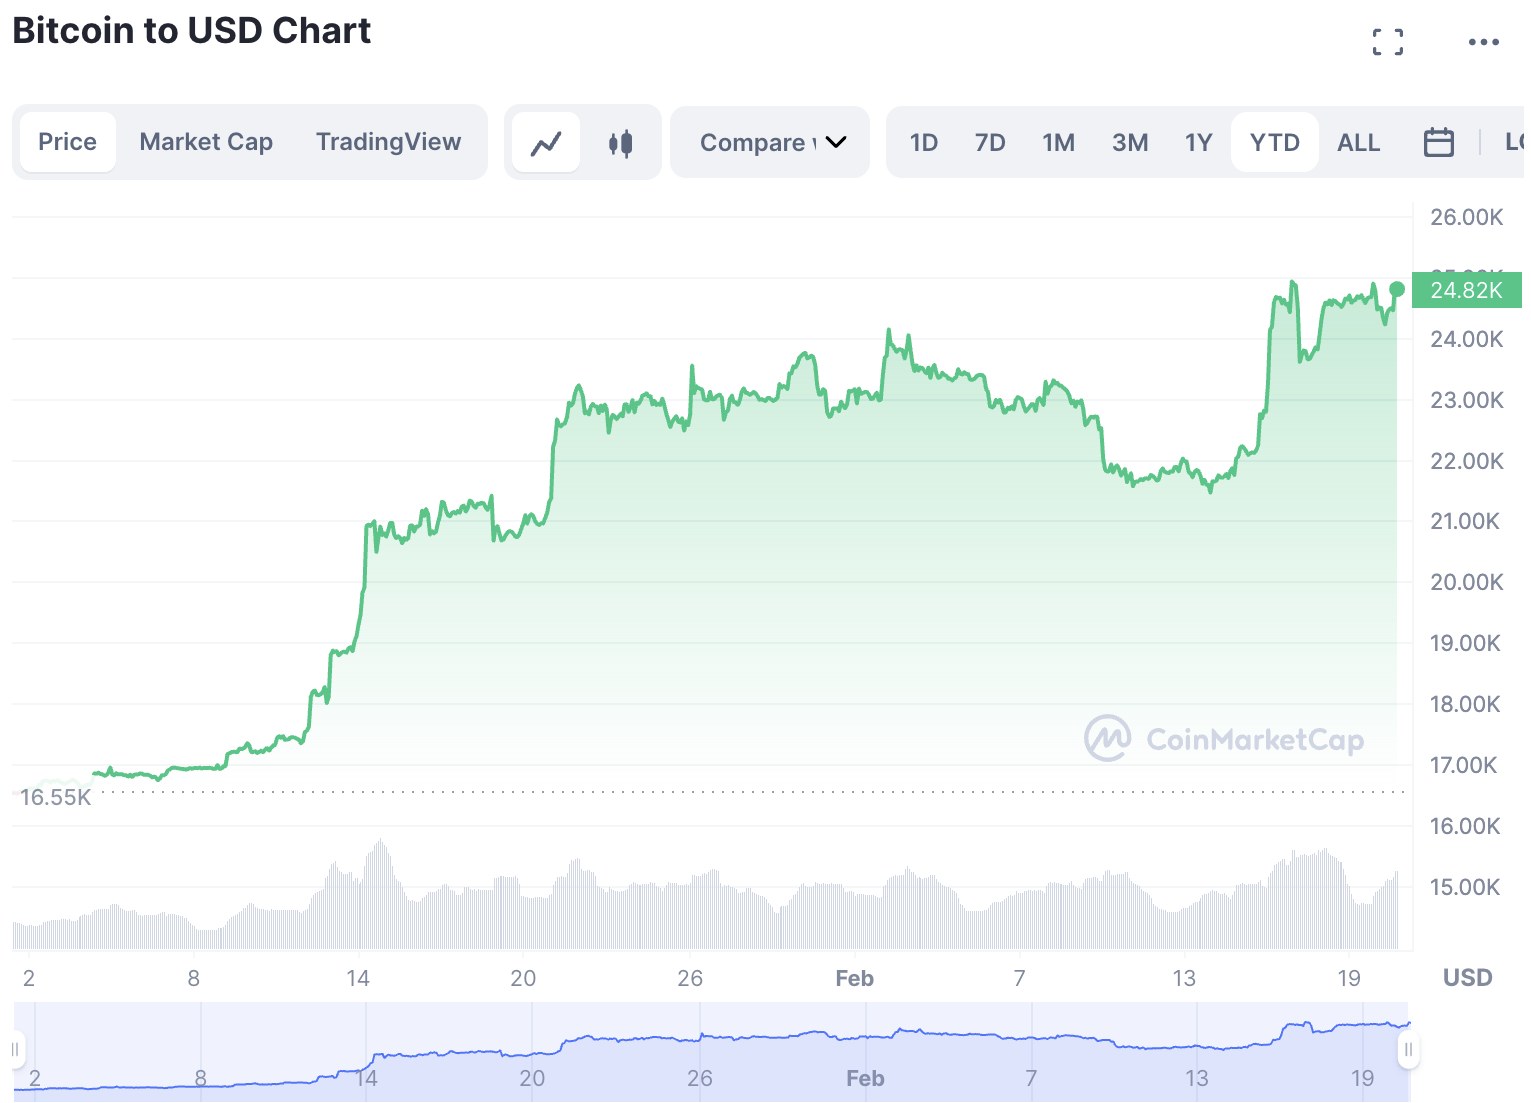
BTC’s price has been fluctuating over the previous days. In the last week alone, we have seen Bitcoin’s price move within the range of $21,000 to $24,600. These extreme movements symbolize how volatile and mercurial Bitcoin’s price can be.
Today, BTC is trading at around $24,505. Its price witnessed a drop of 0.92% in the last 24 hours. However, its price has risen about 12% in the last seven days. BTC’s current market capitalization was around $472.9 billion at the time of writing this article. As compared to its previous figure, there has been a drop of about 0.54% in its market cap. In the last 24 hours, BTC’s trading volume saw a surge of around 50.1% and is currently at around $28.5 billion. Whereas BTC’s current total circulating capital is around 19 million BTC.
Bitcoin’s all-time high was around $66,788 in November 2021. Bitcoin is currently trading 62% below its all-time high.
A Close-Up Study of BTC’s SMA and RSI
In financial markets, the moving averages and the relative strength index are crucial tools. The main job of a moving average is to depict price action over a certain period. Moving averages are mainly based on the previous price actions, which makes them a lagging indicator.
On the other hand, the relative strength index is a popular tool to understand whether an asset is oversold or overbought.
For more than a month now, Bitcoin’s 200-Day simple moving average has been signaling BUY. BTC’s 200-Day SMA is now around $19,690. Thus, BTC is currently trading above its 200-Day SMA. This means that BTC is in a bullish movement.
The story is similar to BTC’s 50-Day SMA. Since the second week of January 2023, BTC’s 50-Day SMA has been signaling BUY. Currently, BTC’s 50-Day SMA is around $21,000. BTC’s current trading price is around 14% higher than its 50-Day SMA. This, again, means a bullish movement for BTC.
BTC’s current RSI was at 63 at the time of writing this article. This means that the BTC market is currently in a neutral position.
According to technical experts, in the coming month, BTC’s 50-Day SMA is set to cross its 200-Day SMA. BTC’s 200-Day SMA is predicted to hit above $20,000 in March 2023. During the same time, BTC’s 50-Day SMA is predicted to rise above $24,000. This means there is a possibility of a “golden cross” in the future. This further strengthens the forecast of a strong bullish market soon.
Bitcoin’s Price Trend In The Last 3 Months
In the last three months, Bitcoin’s price has charged upward. In the last month, the coin’s value has increased by 18.5%. In the last three months, the coin’s value has increased by nearly 50%. This demonstrates that the recent market trend for Bitcoin has been bullish.
However, if we look at BTC’s price from one year back, it would give a different picture. Around the same time in 2022, one Bitcoin was trading at around $40,000. Today, one Bitcoin is trading at around $24,505. This means that over the last year, there has been a drop in BTC’s price by almost 40%. Thus, the long-term graph for Bitcoin’s price until today has been depreciative.
Over the last three months, Bitcoin has moved with the range of around $15,730 to $24,620. The average trading price for Bitcoin for these last 3 months has been around $20,170. Bitcoin touched an all-time high of $24,620 in the last 3 months in February 2023. Whereas the all-time low of $15,730 in the last 3 months was witnessed in November 2022.
Bitcoin is a highly volatile asset. However, in recent times Bitcoin has been showing low volatility. The current 1-month volatility rate for Bitcoin is at 3.70. This means that the coin has been more stable and steady than usual. This also means that currently, Bitcoin is prone to lower risk. Low volatility also indicates that an asset is less likely to move dramatically.
Will Bitcoin Touch $25,400 this week?
To understand more about Bitcoin’s current price trend, let’s look at its support and resistance levels. These two figures often help to gain more insight into a cryptocurrency’s price graph.
Bitcoin’s current support levels are at $24,000, $23,745, and $23,189. On the other hand, Bitcoin’s current resistance levels are at $24,349, $25,200, and $25,400.
Bitcoin’s current trading price is still within the important resistance band of $24,349 and $25,400. This $25,400 is the level for a possible BTC breakout to happen. To be able to confirm this breakout, BTC’s weekly candle should close above $25,400. If its weekly candle closes above the estimated $25,400, then there is a possibility that the BTC price may hit above $25,400.
However, if the BTC candle close doesn’t cross $25,400, then its price may drop down to around $23,000.
Concluding Words On Bitcoin
Based on Bitcoin’s price trends in the recent past, it looks like it is still heading upward. As per the majority of its crucial indicators, there is a possibility of continued bullish movement in Bitcoin’s future.
The possibility of a “golden cross” next month increases its chances of heading towards a bullish movement. If that happens, we could see a price rise of beyond $25,400.
However, the closing prices for Bitcoin this week will be of utmost importance. For they will confirm whether BTC’s price will hit $25,400 or drop below $23,000.
Bitcoin (BTC) is the harbinger of the world’s fully decentralized digital asset. Bitcoin is not just a coin but a cryptocurrency movement. Like any traditional asset, Bitcoin is not without its limitations. BTC price is prone to market movement and external factors affecting the market. In the past, Bitcoin has witnessed both positive and negative price swings.
Thus, traders must speculate on the cryptocurrencies’ advantages and disadvantages before investing. It is always wise to get into the trade tools and fundamentals of the cryptocurrency market before making any important decision.
Related Articles
Best Wallet - Diversify Your Crypto Portfolio
- Easy to Use, Feature-Driven Crypto Wallet
- Get Early Access to Upcoming Token ICOs
- Multi-Chain, Multi-Wallet, Non-Custodial
- Now On App Store, Google Play
- Stake To Earn Native Token $BEST
- 250,000+ Monthly Active Users
Join Our Telegram channel to stay up to date on breaking news coverage


