

Join Our Telegram channel to stay up to date on breaking news coverage

Bitcoin continues to trade near yearly lows and many investors are taking comfort in the popular saying, ‘The bigger the base, the higher the space.’ but has the digital currency actually found a bottom yet?
Daily Chart
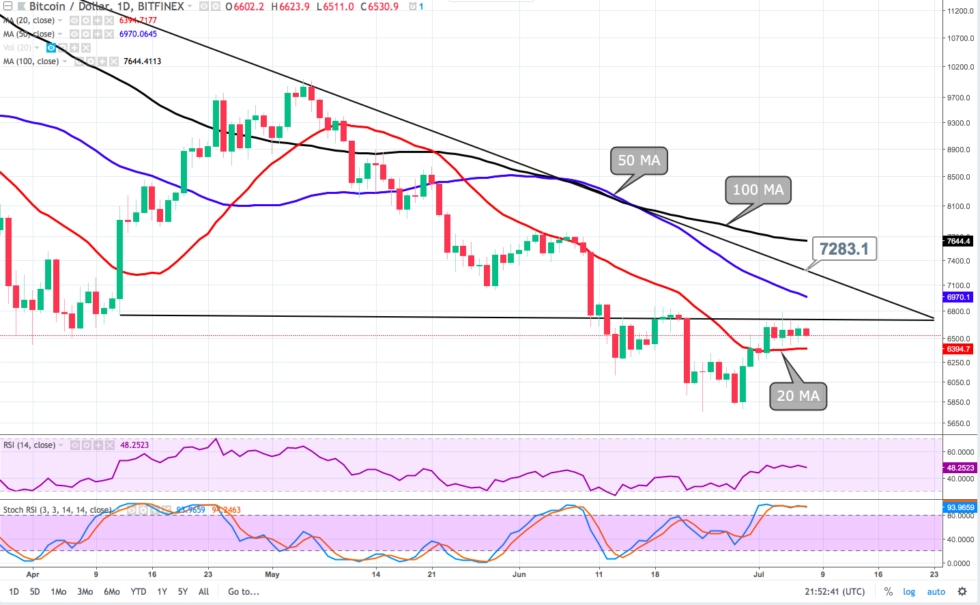
This week BTC 00 struggled to break above the descending triangle bottom and so far has traded in a tightening $400 range. Later in the day, Bitcoin dipped below the 20MA and short-term technical charts remain biased toward bears.
The neckline of last week’s double bottom near $6,250 now serves as a support and a decline beneath this point would be problematic. At the same time, an inverse head and shoulders formation is beginning to appear and if BTC continues to decline below the 20 and 50-MA the right shoulder of the H&S pattern would be complete and BTC could make a quick leap from $6,050 to the descending triangle bottom at $6,705.
To date, the general consensus amongst those in the ‘learned’ community is that BTC has yet to bottom and barring a high volume move above $6,705 that is sustained for longer than a day or two, BTC is more likely to decline than gain over the short term.
4 Hour Chart
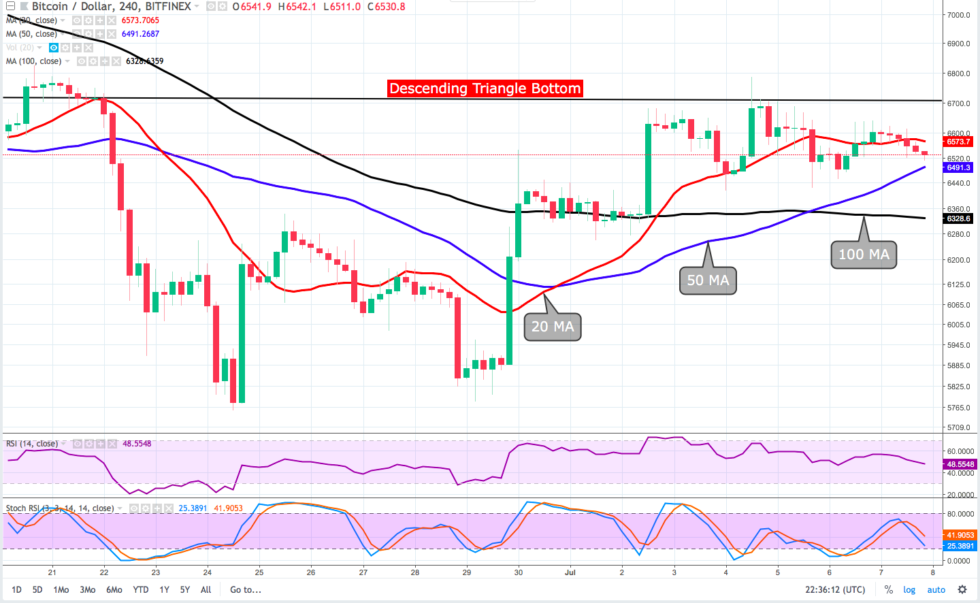
At the time of writing the Bitcoin wavers near the 50-MA and Stoch angles sharply downward, dipping into oversold territory, while the RSI has flattened throughout the day and currently hovers near 48.
The general short-term setup for BTC is quite bearish and a decline to the 100-MA could produce a rally to the descending triangle bottom at $6,705 and BTC is likely to meet stiff resistance at $7,000.
Bitcoin Price: Looking Ahead
Bitcoin remains bearish for the short term and could decline below the 50 and 100 MA.
Completion of the inverse H&S formation could produce a quick rally to the descending triangle bottom at $6,705.
A BTC decline and close below $6,250 could resume the sell-off.
[Disclaimer: The views expressed in this article are not intended as investment advice. Market data is provided by BITFINEX. The charts for analysis are provided by TradingView.]
Where do you think Bitcoin price will go this week? Let us know in the comments below!
Images courtesy of ShutterStock, Tradingview.com
The post Bitcoin Price Analysis: The Bigger the Base, the Higher the Space? appeared first on Bitcoinist.com.
Join Our Telegram channel to stay up to date on breaking news coverage