Join Our Telegram channel to stay up to date on breaking news coverage
Bitcoin Price Analysis (BTC) – August 6
BTC breaks below $12k, stronger rebound expected. The coin remains in buy phase despite the recent price fall.
BTC/USD Long-term Trend: Bullish (Daily Chart)
Key levels:
Supply Levels: $13,000, $13,500 $14,000
Demand Levels: $9,500, $9,000, $8,500
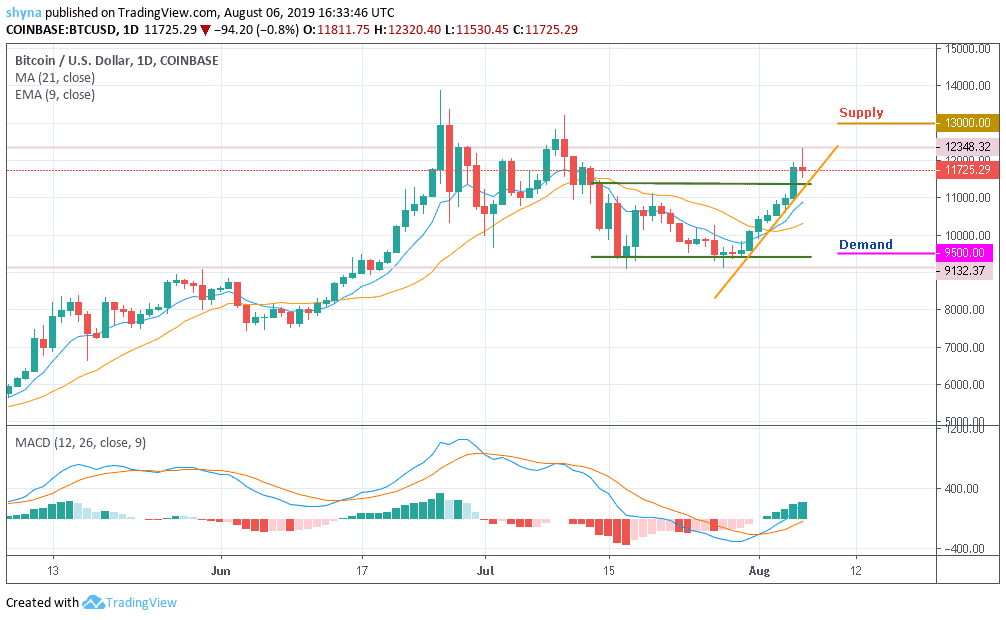
Bitcoin bulls are intentional about finding higher support for Bitcoin. This battle comes after BTC tried and failed to extend gains past $12,348 which happens to be the daily high as at the time of writing. Bitcoin price is back under $12,000 and currently exchanging hands at $11,725. Moreover, Bitcoin price is moving above both the 21-Day Moving Average and the 9-Day Exponential Moving Average.
Furthermore, as long as the 9 EMA remains above the 21 MA, traders can expect BTC to consolidate at higher levels. That’s if we could see a further climb above the $12,000 which is fast approaching; it may likely reach the supplies at $13,000, $13,500 and $14,000. Meanwhile, the critical demand level to watch out for lies at $9,500, $9,000 and $8,500 respectively.
Currently, Bitcoin price follows a dominant bullish bias. A glance at the Moving Average Convergence Divergence (MACD) displays a positive picture for BTC in the near-term. Besides, maintaining a gradual upward slope in the positive region, the MACD divergence is increasing as a signal for growing buying entries.
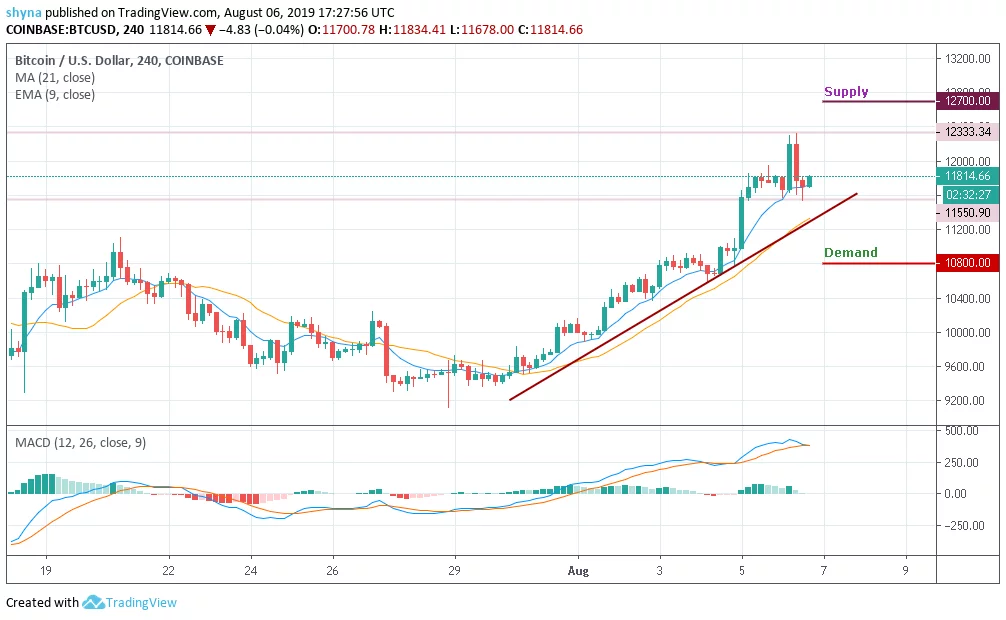
BTC/USD Medium-term Trend: Bullish (4H Chart)
Bitcoin continued its bullish trend against USD since yesterday; however, today’s price move was the most impressive one as it climbed above $12,300 with a sharp surge. However, for the past 4 hours, BTC/USD has lost its price position trading below $12,000. Bitcoin maintained it’s bull-run and hit the price point above $12,300.

Above the said price mark, BTC couldn’t fight the supply and it took a downward move. The coin breached major demand near $11,700 and reached $11,500. Here, the coin appears to have found decent demand as the coin started its recovery while tracing a bullish trend line. MACD chart for Bitcoin is lowly volatile and it just had a bullish crossover and it may see demand at $10,800 and supply at $12,700.
Please note: insidebitcoins.com is not a financial advisor. Do your own research before investing your funds in any financial asset or presented product or event. We are not responsible for your investing results.
Join Our Telegram channel to stay up to date on breaking news coverage