Join Our Telegram channel to stay up to date on breaking news coverage
The Bitcoin price surged 2% in the last 24 hours to trade at $72,146 as of 04:24 a.m. EST on trading volume that surged 10% to $52.16 billion.
This comes as the BTC price hit a high of $73,577 on Oct. 29, just shy of the all-time high price of $73,750 recorded in March this year.
Bitcoin is up 111.8% in the past year, after starting 2024 in the $42K range, according to CoinGecko.
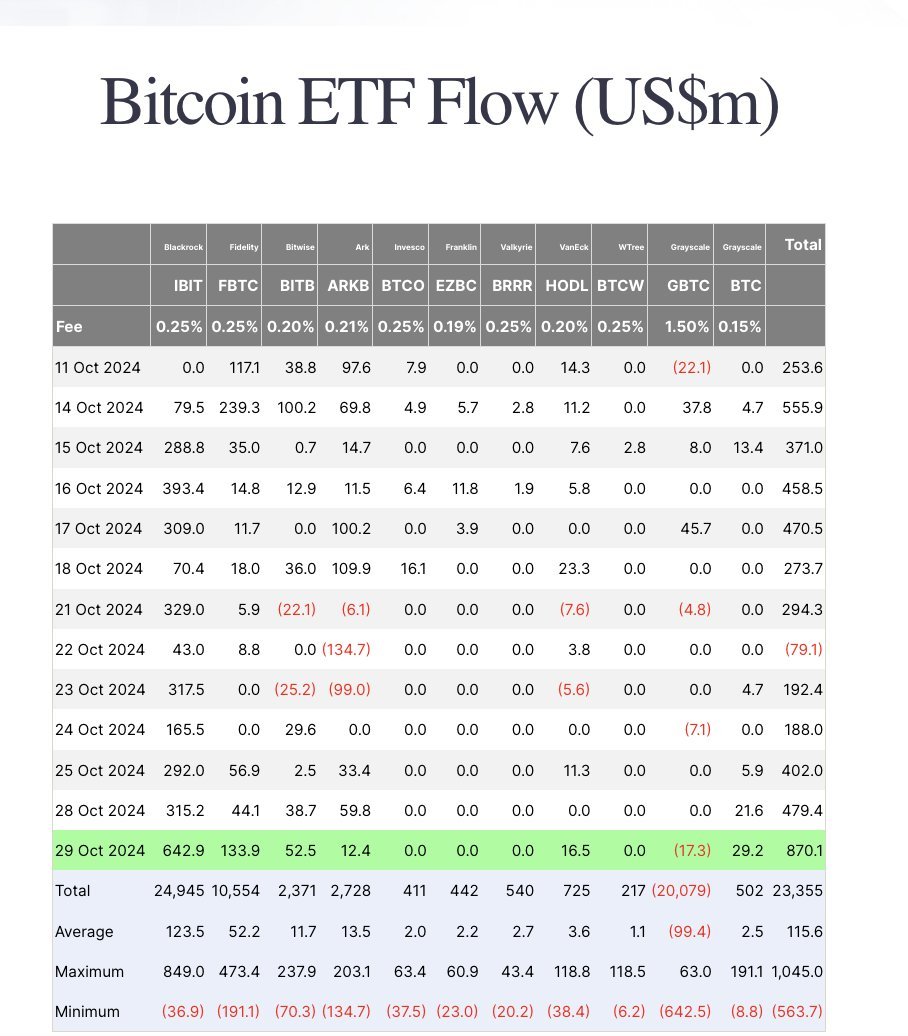
This comes as US spot BTC ETFs (exchange-traded funds) saw over $870 million in net inflows on Tuesday, the third highest since launch, with BlackRock’s IBIT leading the way with a $629 million influx.

Bitcoin Price Bulls Aim To Sustain The Bullish Stance
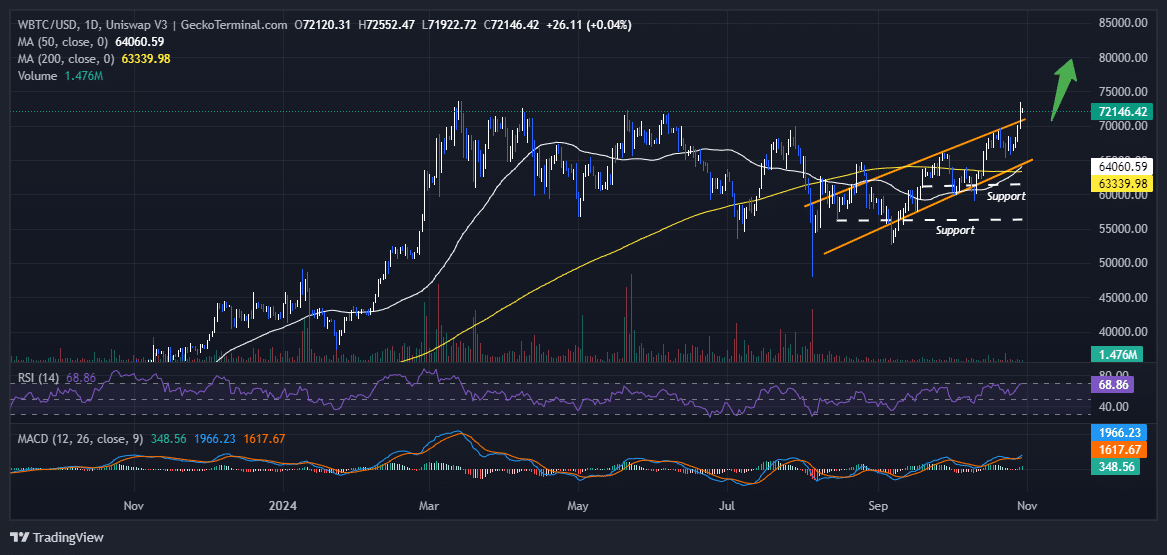
The Bitcoin price is trending within an upward channel marked by two orange lines. This channel, starting around August, represents a bullish trend with higher highs and higher lows, indicating growing buying pressure.
BTC/USD analysis on the 1-day chart is trading near the top of this channel at around $71,000, which is a resistance level. According to data from GeckoTerminal, if it breaks above this, we could see further upside momentum.
The price of Bitcoin now trades above both the 50-day and 200-day Simple Moving Averages (SMAs), affirming the current bullish stance.
The Relative Strength Index (RSI) is at 69.33, close to the overbought level of 70. This suggests that BTC is nearing an overbought condition, which might lead to a short-term pullback or consolidation. However, if it crosses above 70, it could indicate strong bullish momentum but with a risk of eventual correction.
Meanwhile, the Moving Average Convergence Divergence (MACD) line (blue) is above the signal line (orange), and both lines are above the zero line, reinforcing a bullish signal.

Bitcoin Price Analysis
According to the Bitcoin price analysis, BTC is currently in a bullish trend. The bulls aim to capitalize on the SMAs and the main indicators, including the RSI and MACD. If the price can break above the $73,000 resistance level with strong volume, it could signal a continuation of the uptrend. Targets in such a breakout could potentially be near $80,000 or higher.
Conversely, the dotted lines around $61,359 and near $56,405 mark significant support zones. These are levels where the price previously consolidated, making them potential pullback areas if the price corrects from current levels.
Meanwhile, investors are rushing to buy the new meme coin Pepe Unchained (PEPU), which YouTube channel 99Bitcoins, with over 706K subscribers, says has the potential to soar 10X after launch.
Pepe Unchained Races Toward $24 Million – Best Crypto To Buy Now?
The Pepe Unchained presale is one of the most successful of the year with funds raised now reaching $23.4 million.
True to its name, Pepe Unchained seeks to liberate the OG PEPE from the constraints of its outdated Layer 1 infrastructure on Ethereum.
That’s why the project will operate on its own Layer 2 blockchain, tackling scalability, speed, and efficiency issues.
Who needs some Brain Powder?
Pepe is gearing up for the official launch of his very own blockchain! 🚀 pic.twitter.com/kZC72UmxFy
— Pepe Unchained (@pepe_unchained) June 20, 2024
Token holders can earn passively through the platform’s staking system, which offers a huge annual percentage yield (APY) of 99%.
You can buy $PEPU tokens for $0.01189 each right now. With a price hike coming in less than 19 hours, buy soon to lock in the best deal.
To join the presale, buy $PEPU from the official website here using ETH, USDT, or a bank card.
Related News
- How to Buy Bitcoin Online Safely
- Bitcoin (BTC) Price & Future Predictions
- How to Buy Bitcoin with Debit Card
Most Searched Crypto Launch - Pepe Unchained
- Exchange Listings December 10
- ICO Sold Out Early
- Featured in Cointelegraph
- Layer 2 Meme Coin Ecosystem
- SolidProof & Coinsult Audited
Join Our Telegram channel to stay up to date on breaking news coverage


