

Join Our Telegram channel to stay up to date on breaking news coverage
Key Points Bitcoin gold price is trading in a range above the $260-270 support area against the US Dollar. There is a crucial contracting triangle forming with support at $270 on the hourly chart of BTG/USD (data feed from Bitfinex). The pair need to move above the $290 resistance and the 100 hourly simple moving average to gain momentum.
Bitcoin gold price is approaching a short term break with support at $270 against the US Dollar. BTG/USD might move above $295 to gain traction.
Bitcoin Gold Price Support
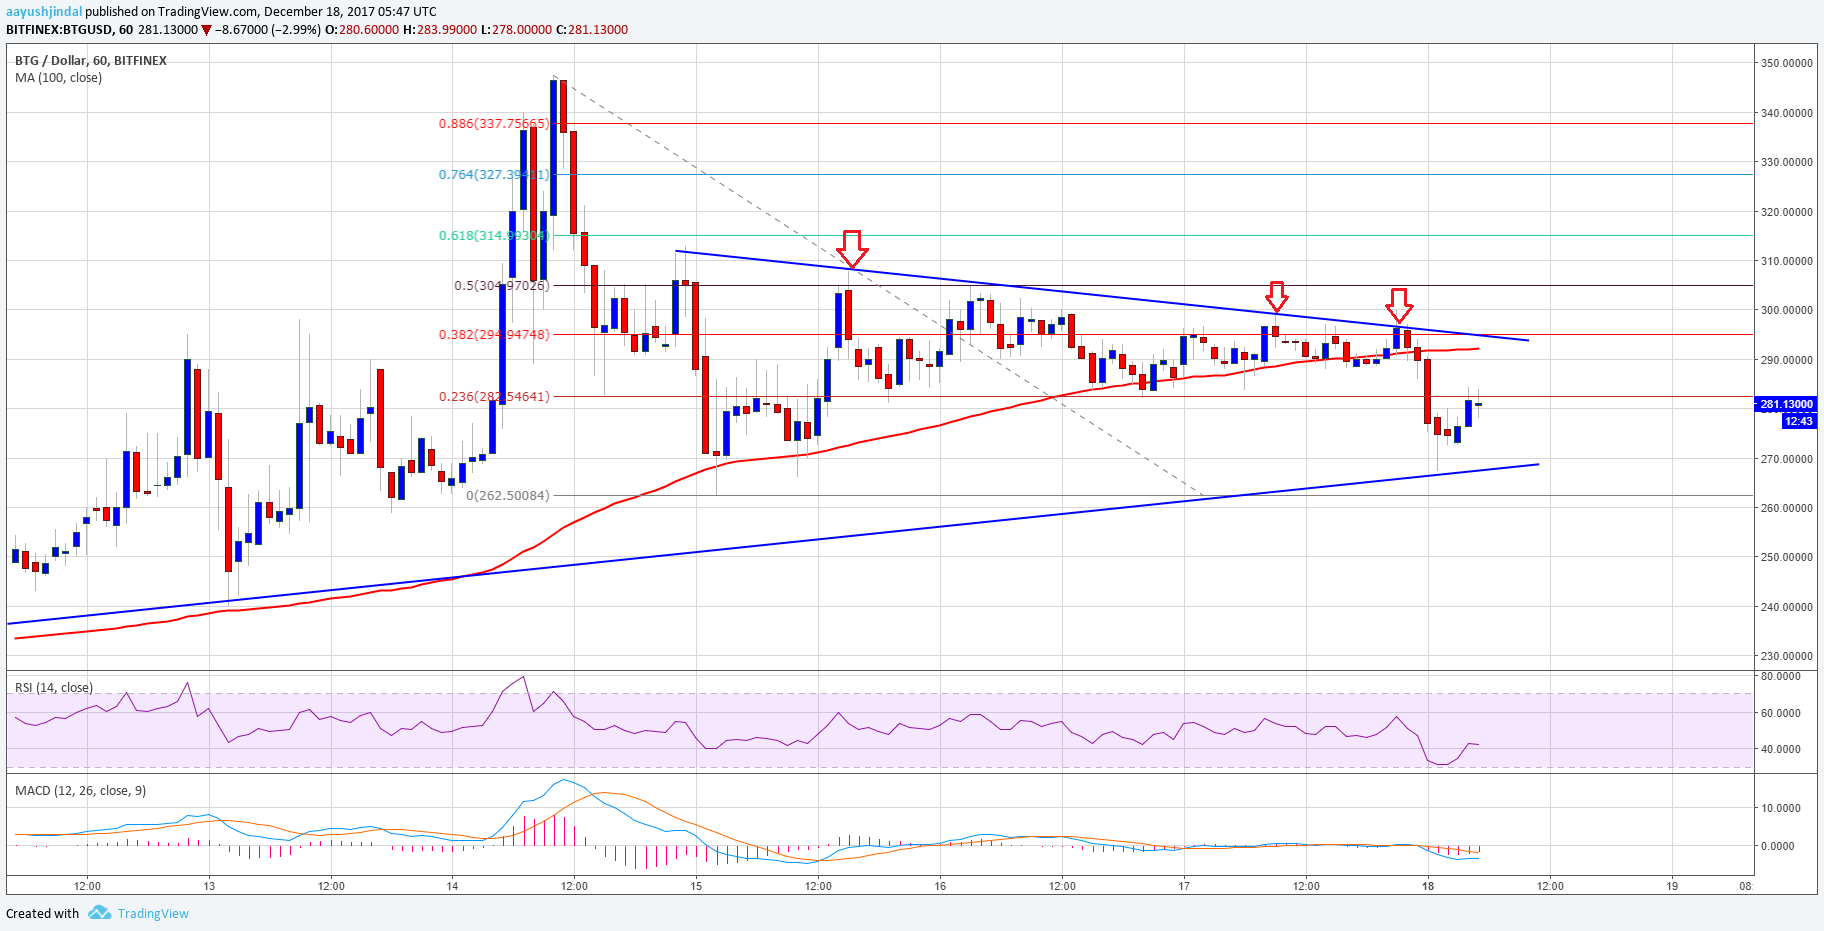
There were more than two rejections from the $260 support area in bitcoin gold price against the US Dollar. On the other hand, there were more than three rejections from well above $300. Therefore, the price seems to be struggling to gain traction above $300 and is currently trading in a range. The price recently traded above the 38.2% Fib retracement level of the last decline from the $348 high to $262 low. However, it failed to move above the $300-310 resistance.
It also failed to break the 50% Fib retracement level of the last decline from the $348 high to $262 low. It seems like there is a crucial contracting triangle forming with support at $270 on the hourly chart of BTG/USD. The triangle resistance is currently at $290-295. More importantly, the 100 hourly simple moving average is at $290 to act as a major barrier for buyers. A break above the $295 hurdle could ignite an upside break above $310 in the near term.
The next major resistance could be $327 and the 76.4% Fib retracement level of the last decline from the $348 high to $262 low. On the downside, the $270 support holds the key.
Looking at the technical indicators:
Hourly MACD – The MACD for BTG/USD is about to move back in the bullish zone.
Hourly RSI (Relative Strength Index) – The RSI for BTG/USD is near 42 and is currently flat.
Major Support Level – $260
Major Resistance Level – $295
Charts courtesy – Trading View, Bitfinex
The post Bitcoin Gold Price Technical Analysis – BTG/USD Approaching Break? appeared first on NEWSBTC.
Join Our Telegram channel to stay up to date on breaking news coverage