Join Our Telegram channel to stay up to date on breaking news coverage
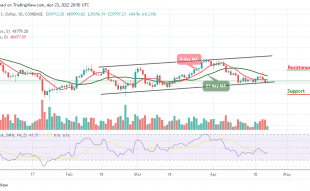
The Bitcoin Cash price prediction falls toward the lower boundary of the channel as the selling pressure may take over the market.
BCH/USD Market
Key Levels:
Resistance levels: $400, $420, $440
Support levels: $250, $230, $210
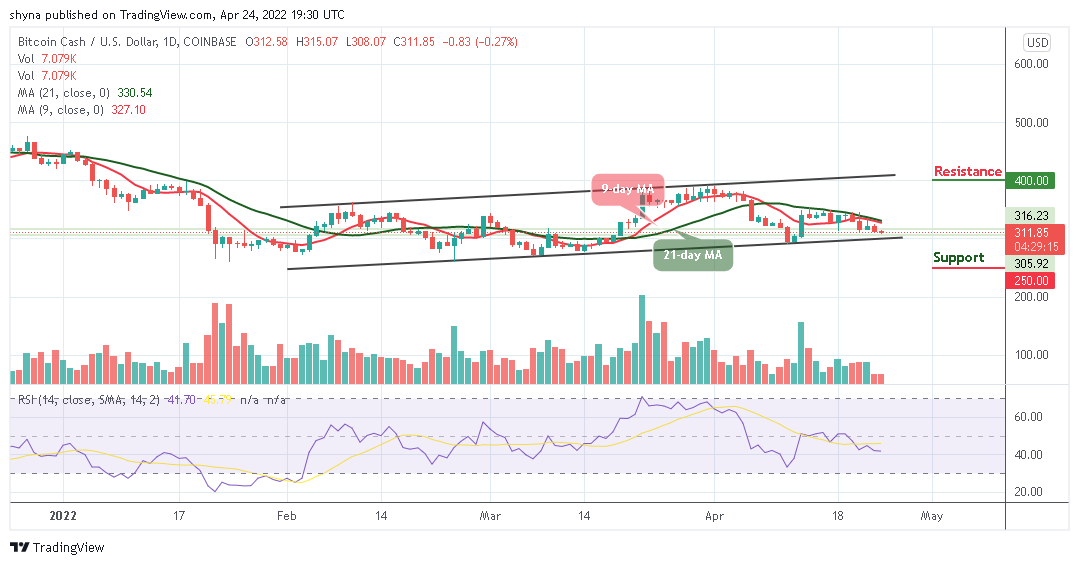
BCH/USD is looking to slow down and may settle below the $300 support level. However, the market price breaks down today, touching its lowest daily level at $308. In addition, the current performance of the Bitcoin Cash is below the normal expectations as the coin may gain more downtrends in the next negative direction.
Bitcoin Cash Price Prediction: What Could Be the Next Direction?
If the Bitcoin Cash price fails to push the price above the 9-day and 21-day moving averages, there is a risk of a fresh bearish wave. However, if the coin drops below the lower boundary of the channel, the initial support may be located at the $300 level where the market price could restart its decline.
As the technical indicator Relative Strength Index (14) reveals the possible downtrend, any bearish crossing below the 40-level could lead to the critical supports at $250, $230, and $210. Nevertheless, a high swing towards the upper boundary of the channel could take the bulls to a key resistance level of $350. If this is possible, the coin may trigger a bullish rally which could take the market price to $400, $420, and $440 resistance levels.
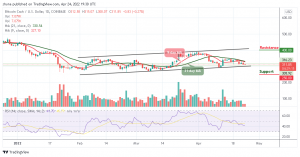
When compared with Bitcoin, the daily chart reveals that the sellers continue to show some commitment to the market movement. However, following the recent negative signs, the trend may continue to go down if the bears keep on putting more pressure on the market.
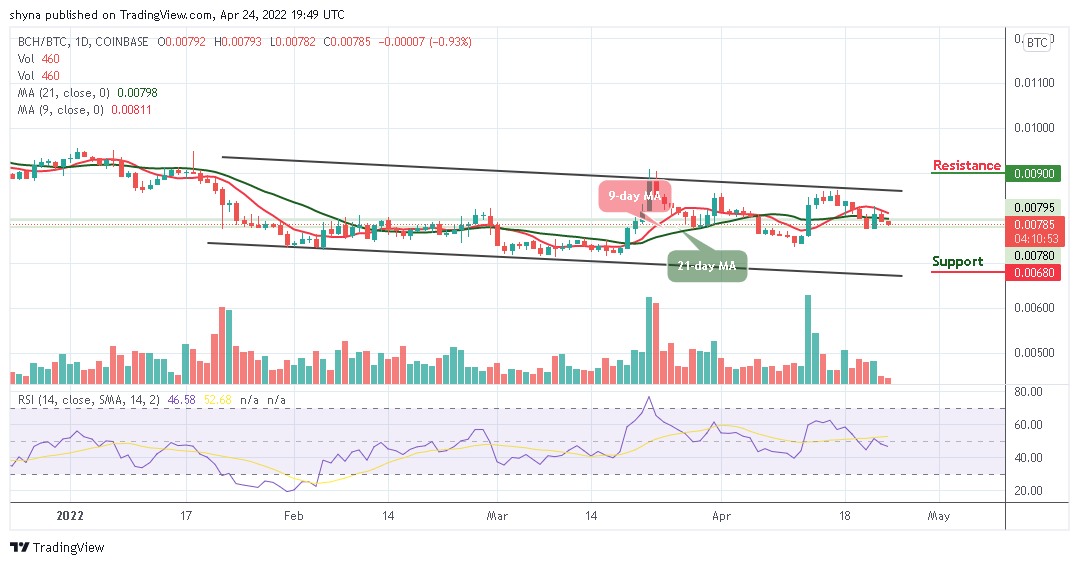
However, as the technical indicator Relative Strength Index (14) moves below the 50-level, if the buyers failed to hold the support of 750 SAT, the market price may focus on the downtrend, and crossing below the lower boundary of the channel may take it to the nearest support at 680 SAT and below, but a rebound could take the price above the 9-day and 21-day moving averages, moving towards the upper boundary of the channel could locate the resistance at 900 SAT and above.
Looking to buy or trade Bitcoin Cash (BCH) now? Invest at eToro!
68% of retail investor accounts lose money when trading CFDs with this provider
Read more:
- How to buy Bitcoin Cash
- How to buy Cryptocurrency
- Bitcoin Cash Price Prediction: BCH/USD Bears Resume Back After Two Straight Bullish Days
Join Our Telegram channel to stay up to date on breaking news coverage