Join Our Telegram channel to stay up to date on breaking news coverage
BCH Price Prediction – July 12
The Bitcoin Cash sees bulls to $245 resistance level but the price settles on $245 support.
BCH/USD Market
Key Levels:
Resistance levels: $255, $275, $295
Support levels: $220, $200, $180
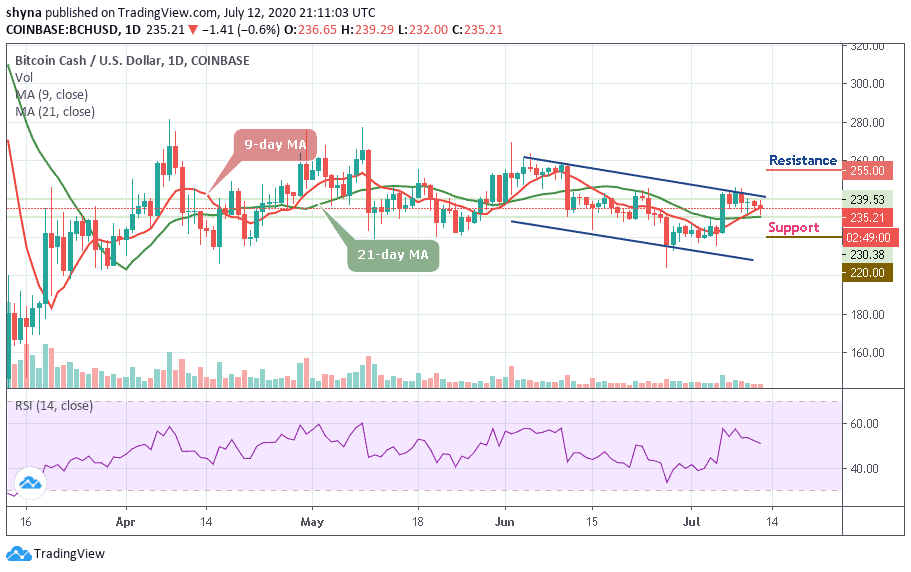
At the time of writing, BCH/USD is pushing for consolidation around $235 but the trend has a bearish inclination, which may likely retest the support at $230 as it may move below the 9-day and 21-day moving averages. Similarly, the technical indicator is seen giving the bearish signals as the RSI (14) faces the negative region which reflects the influence the sellers have over the price.
However, the best the bulls can do is defending the support at $230 and focus on pulling towards $240. A few days ago, the Bitcoin Cash lost balance alongside other cryptos and the sharp drop affected the buyers from an attempted recovery above $246. However, BCH/USD is making an effort to jump above $235 and it is also looking forward to reclaiming the ground past $239.
The coin is already at the negative side and therefore a reflex bullish action is expected to correct the declines with a possible jump above $240. Meanwhile, if there is an increase in buying pressure, the price may break out of the ascending channel to reach the $250 resistance. While trading at that level, a bullish continuation could reach the resistance levels of $255, $275, and $295 respectively.
In other words, a minimum swing may likely push the market to a $250 level of support. Exceeding this level could take the bears to $220, $200, and $180 levels by crossing below the moving averages.
Against Bitcoin, the daily chart reveals that traders have yet to show a strong commitment to buying on the market. Meanwhile, as soon the bulls turn strong, we may expect the market to skyrocket above the channel to the resistance levels of 2650 SAT and above.

In other words, the 2450 SAT and 2400 SAT may likely produce support for the market should in case the buyers fail to push the price above the channel. The BCH/BTC pair may continue to show the downward trend while the technical indicator RSI (14) signal line below the 55-level.
Join Our Telegram channel to stay up to date on breaking news coverage