Join Our Telegram channel to stay up to date on breaking news coverage
Bitcoin Cash Price Prediction – July 4
The Bitcoin Cash upsurge astounds the intraday traders as the price movement indicates a bit of the immediate resistance level.
BCH/USD Market
Key Levels:
Resistance levels: $750, $800, $850
Support levels: $350, $300, $250
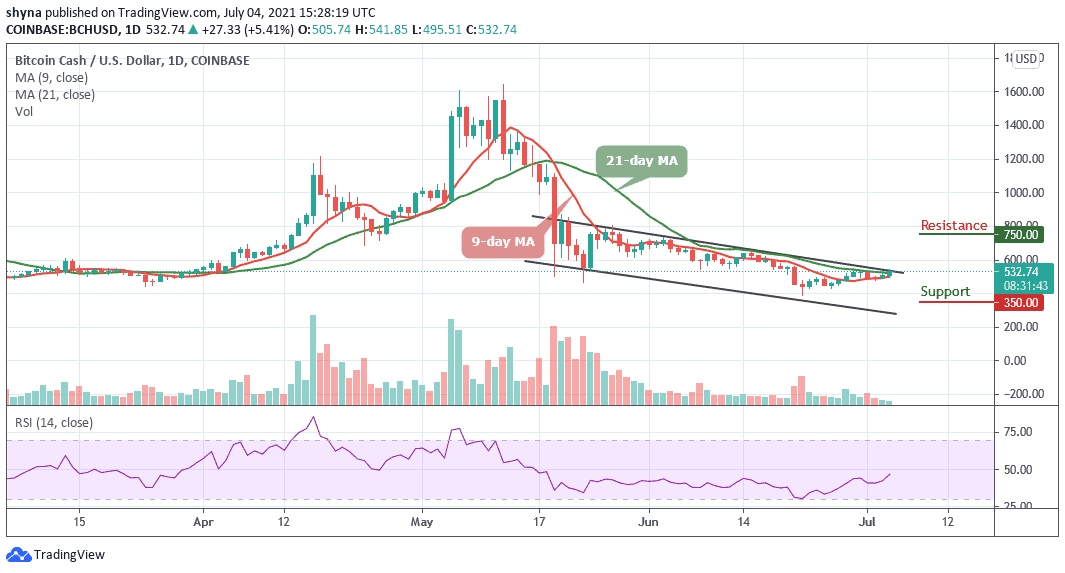
BCH/USD seems to be picked up its pace as the coin is rising towards $600. Following the recent price drop, Bitcoin Cash is currently trading above the 9-day and 21-day moving averages. However, a break above the upper boundary of the channel may likely produce a huge green candle to the upside, and this may cause the Bitcoin Cash to reach the resistance levels at $750, $800, and $850 levels.
Bitcoin Cash Price Prediction: Bitcoin Cash Price May Jump
The Bitcoin Cash price seems moving sideways; it has been showing an uneven movement with several rises and falls. BCH/USD has not been able to maintain a consistent bullish run as the Relative Strength Index (14) moves to cross above 50-level, a precise bullish cross might reveal more buy signals for the market and it may continue to show signs of an upward movement in the market soon.
On the contrary, a bearish step back is likely to roll the market back below the 9-day and 21-day moving averages with a possible break down to $350, $300, and $250 supports which could establish a new low for the market. In addition, traders can also see that the trading volume is rising slowly, giving a sign of an upcoming big move.
When compares with Bitcoin, the BCH bears are still showing a strong commitment to bringing the market price back to the downside. Following the recent negative sign, the Bitcoin Cash price may go down if the sellers put more pressure on the market further.
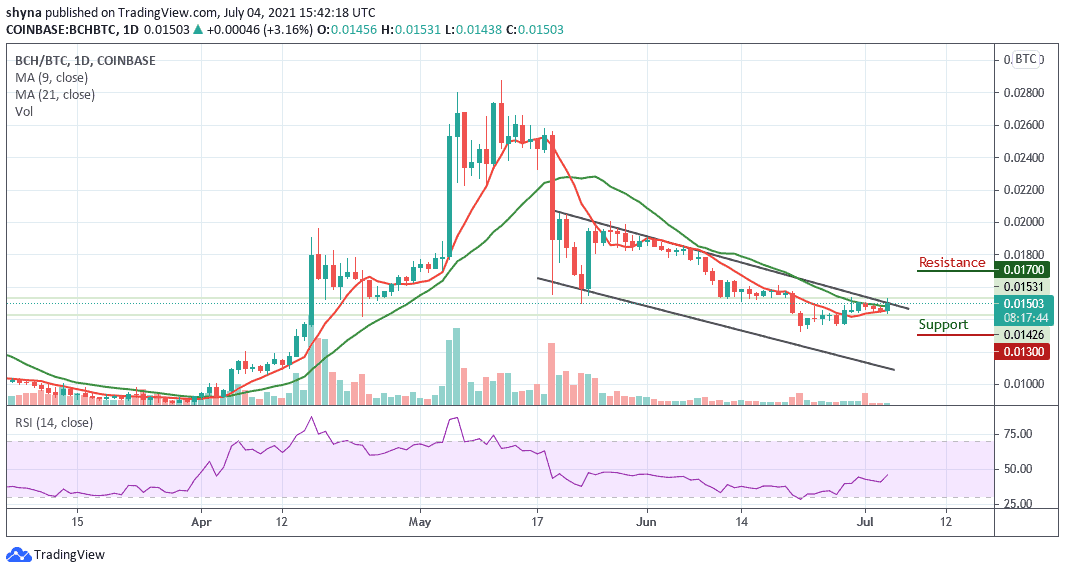
However, as the Relative Strength Index (14) is facing the upside, should the buyers hold the current price of 0.015 BTC, BCH/BTC may continue with the upward movement and possibly cross the upper boundary of the channel to touch the resistance level of 0.017 BTC and above but sliding below the 9-day and 21-day moving averages could lower the price to 0.0113 BTC and below.
Looking to buy or trade Bitcoin Cash (BCH) now? Invest at eToro!
75% of retail investor accounts lose money when trading CFDs with this provider
Join Our Telegram channel to stay up to date on breaking news coverage