
Join Our Telegram channel to stay up to date on breaking news coverage
Bitcoin Cash Price Prediction – July 12
The Bitcoin Cash sees bulls to $470 resistance level after the coin touches the daily low of $446 support.
BCH/USD Market
Key Levels:
Resistance levels: $750, $800, $850
Support levels: $200, $150, $100

At the time of writing, BCH/USD is pushing for consolidation around $462 but the trend has a bearish inclination, which may likely retest the support at $400 as it may keep the price below the 9-day and 21-day moving averages. However, the technical indicator is seen giving a sideways movement as the Relative Strength Index (14) moves in the same direction which reflects the influence the sellers have over the price.
Bitcoin Cash Price Prediction: Any Drawdown Likely?
The Bitcoin Cash price is seen hovering under the 9-day and 21-day moving averages. Meanwhile, the best the bulls can do is defending the support at $400 and focus on pulling towards $350. A few days ago, the Bitcoin Cash lost balance alongside other cryptos and the sharp drop affected the buyers from an attempted recovery above $450. However, BCH/USD is making an effort to jump above $500 and it is also looking forward to reclaiming the ground past $600.
The Bitcoin Cash price is already on the negative side and therefore a reflex bullish action is expected to correct the declines with a possible jump above $700. Meanwhile, if there is an increase in buying pressure, the price may break above the 9-day and 21-day moving averages to reach the $700 resistance. While trading at that level, a bullish continuation could push the coin to the resistance levels of $750, $800, and $850 respectively.
On the contrary, a minimum swing may likely bring the market to a $300 level of support. Exceeding this level could take the bears to the supports of $200, $150, and $100 by crossing below the lower boundary of the channel.
Against Bitcoin, the daily chart reveals that traders have yet to show a strong commitment to buying on the market. Meanwhile, as soon the bulls turn strong, traders may expect the market to skyrocket above the channel to hit the resistance level of 1800 SAT and above.
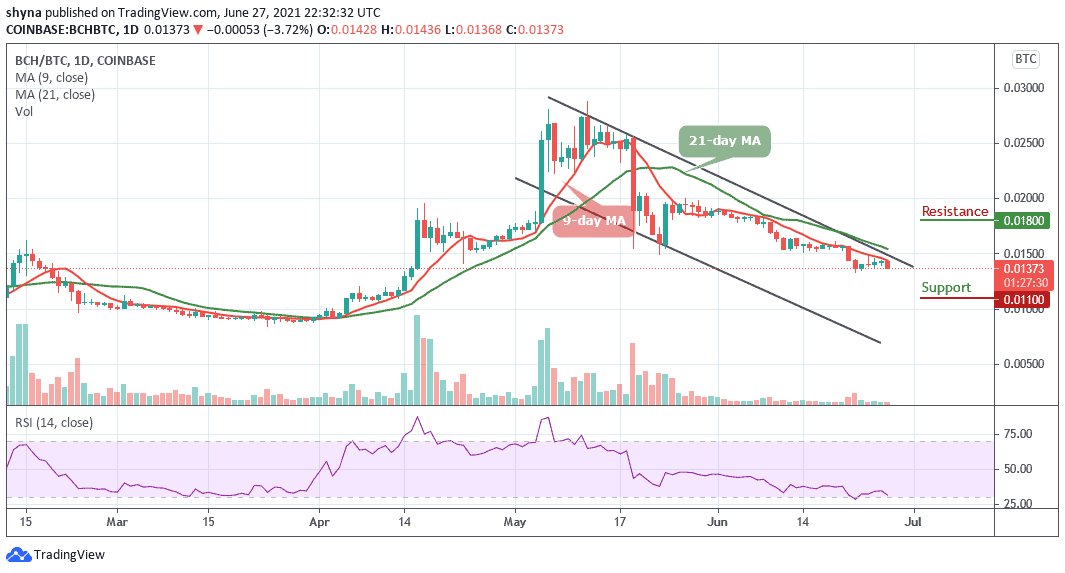
However, the 1200 SAT may likely produce support for the market should in case the buyers fail to push the price above the channel. Therefore, BCH/BTC pair may continue to show the downward trend as the technical indicator Relative Strength Index (14) signal line moves to cross below into the oversold region.
Looking to buy or trade Bitcoin Cash (BCH) now? Invest at eToro!
75% of retail investor accounts lose money when trading CFDs with this provider
Join Our Telegram channel to stay up to date on breaking news coverage
