Join Our Telegram channel to stay up to date on breaking news coverage
Bitcoin Cash Price Prediction – February 12
The Bitcoin Cash price is recovering from the daily low of $312 level as the price remains within the short-term bullish trend.
BCH/USD Market
Key Levels:
Resistance levels: $430, $450, $470
Support levels: $225, $205, $185
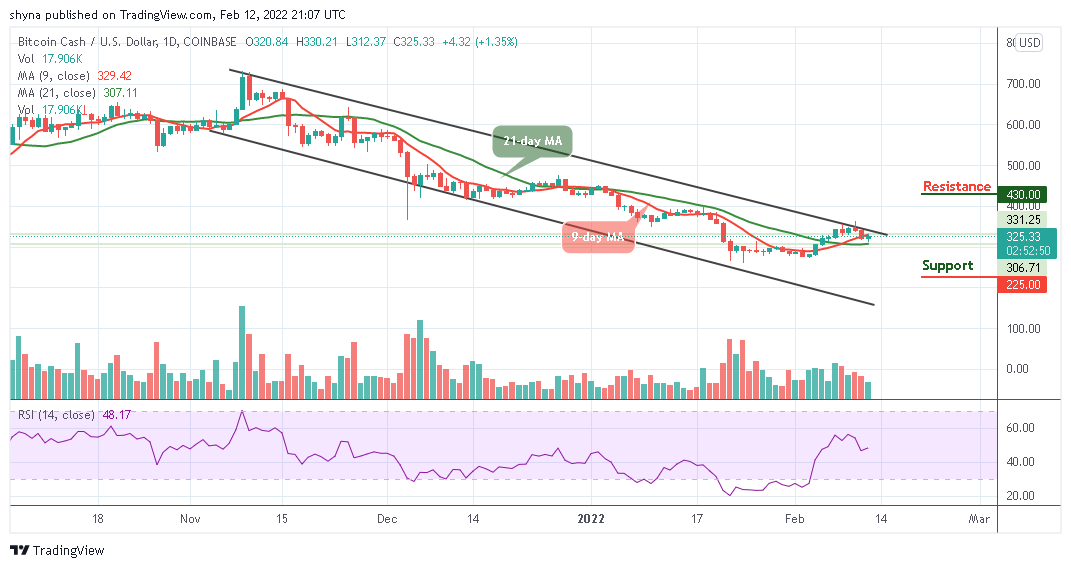
BCH/USD is trading within the 9-day and 21-day moving averages after touching the daily low at $312. At the time of writing, the Bitcoin Cash is changing hands at $325.33, having gained over 1.35% since the beginning of the European session. However, with latest the recovery, the digital asset is likely to cross above the upper boundary of the channel.
Bitcoin Cash Price Prediction: Can BCH Break Above $350?
The Bitcoin Cash price is currently above the 21-day moving average as the coin gets ready for the upside. However, if the bulls maintain the upward trend, BCH/USD may likely cross above the channel which could touch the resistance levels of $430, $450, and $470. In other words, any strong selling pressure below the 21-day MA may drag the price towards the lower boundary of the channel if the bears step back into the market.
However, should in case Bitcoin Cash trades below the 21-day moving average, a bearish continuation could bring the price to the supports of $225, $205, and $185. Meanwhile, the technical indicator Relative Strength Index (14) is seen moving around 47-level, indicating a possible bullish movement.
Against Bitcoin, the BCH bulls are now showing little commitment to the market movement. However, following the recent positive sign, the current market movement may follow an uptrend if the buyers push the price towards the upper boundary of the channel.
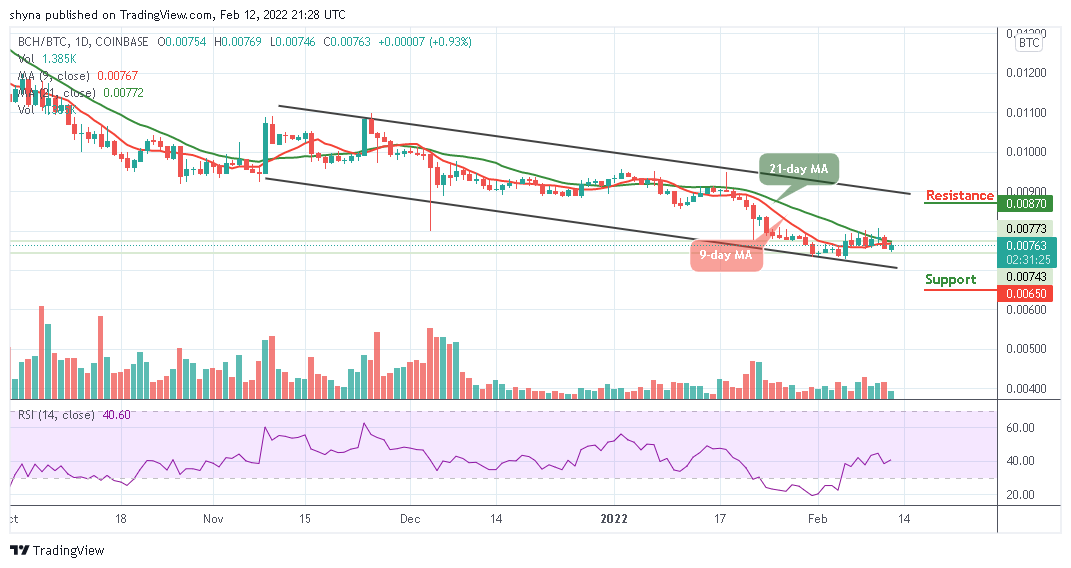
Moreover, as the technical indicator Relative Strength Index (14) is moving to cross above 40-level, the market price could resume an upward trend to cross above the moving averages which could touch the resistance level of 870 SAT and above. Meanwhile, a retest below the lower boundary of the channel could lower the price to the support level of 650 SAT and below.
Looking to buy or trade Bitcoin Cash (BCH) now? Invest at eToro!
68% of retail investor accounts lose money when trading CFDs with this provider
Read more:
- How to buy Bitcoin Cash
- How to buy Cryptocurrency
Join Our Telegram channel to stay up to date on breaking news coverage