Join Our Telegram channel to stay up to date on breaking news coverage
Key Points
- Bitcoin cash price stayed above the $496 swing low and consolidated against the US Dollar.
- There was a break above a key bearish trend line with resistance at $510 on the hourly chart of the BCH/USD pair (data feed from Kraken).
- The pair struggled to move above the $530 resistance and the 100 hourly simple moving average.
Bitcoin cash price mostly consolidated near $500 against the US Dollar. BCH/USD must break the $530-540 resistance zone for a decent recovery.
Bitcoin Cash Price Analysis
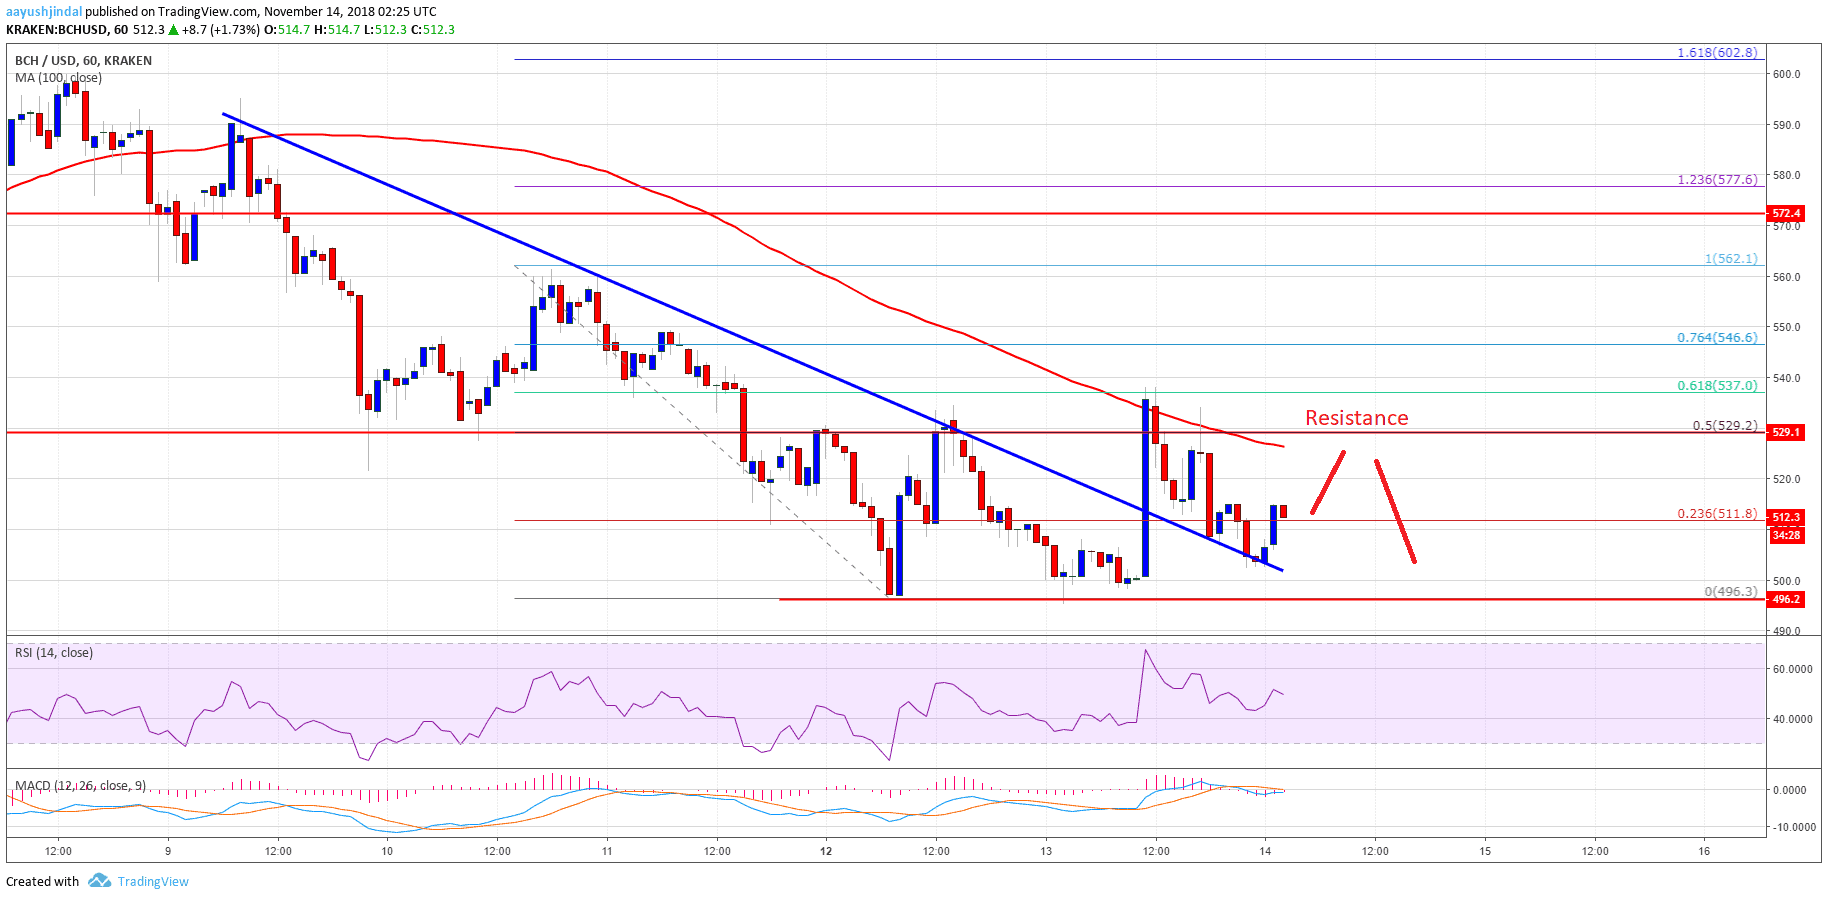
Yesterday, there was another break below the $500 support in bitcoin cash price against the US Dollar. However, the BCH/USD pair found support near the last swing low at $496 and later recovered. It traded above the $505 and $510 resistance levels to start a recovery. The price climbed above the 50% Fib retracement level of the recent decline from the $562 high to $496 low.
Moreover, there was a break above a key bearish trend line with resistance at $510 on the hourly chart of the BCH/USD pair. However, the price struggled to break the $535-540 resistance zone and the 100 hourly simple moving average. Besides, the price was rejected near the 61.8% Fib retracement level of the recent decline from the $562 high to $496 low. As a result, the price retreated and traded below the $520 level. At the outset, the price seems to be consolidating above the $500 level. Buyers must clear the $530, $535 and $540 resistance levels to start a decent rebound.

Looking at the chart, BCH price may continue to stay above the $500 support area. Having said that, if buyers continue to fail near the $535 level, the price may perhaps break the $500 and $495 support levels.
Looking at the technical indicators:
Hourly MACD – The MACD for BCH/USD is still placed in the bearish zone.
Hourly RSI (Relative Strength Index) – The RSI for BCH/USD is currently near the 50 levels.
Major Support Level – $500
Major Resistance Level – $535
The post Bitcoin Cash Price Analysis: BCH/USD Consolidating Near $500 appeared first on NewsBTC.
Join Our Telegram channel to stay up to date on breaking news coverage