Join Our Telegram channel to stay up to date on breaking news coverage
BCH Price Analysis – June 11
Bitcoin Cash [BCH] seems to be caught between the bull and the bear, while the price of the cryptocurrency fluctuates sideways.
BCH/USD Market
Key Levels:
Supply levels: $550, $600, $650
Demand levels: $250, $200, $150

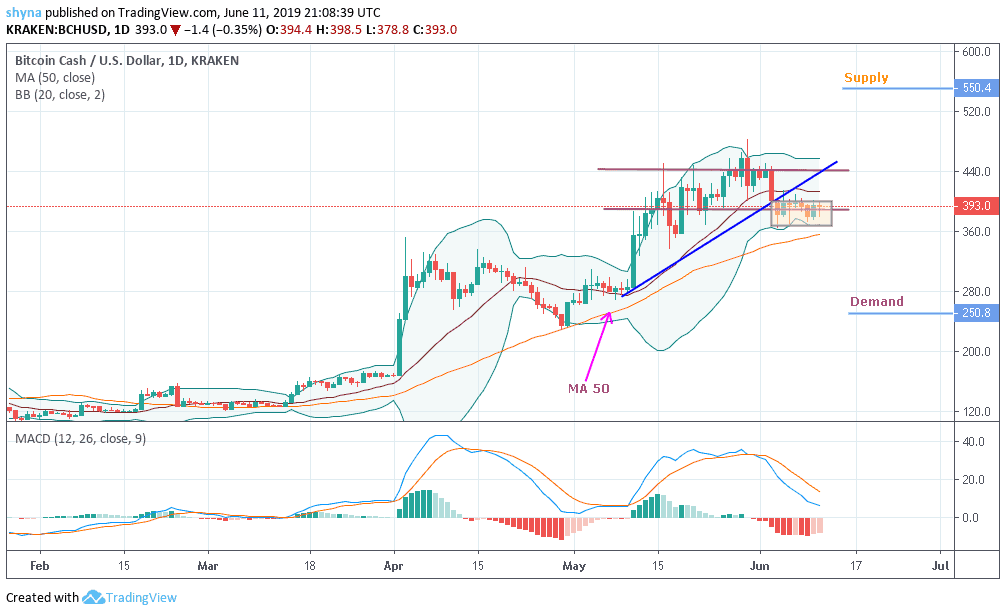
Bitcoin Cash (BCH/USD) is trading at $393. The coin is still trading above the moving average, with a period of 50 indicating a bearish trend in Bitcoin Cash. For the time being, the market price is moving towards the lower limit of the Bollinger bands and MACD is issuing a sell signal.
As part of the Bitcoin cash forecast, the test is expected to reach a $550 supply level. Any attempt by the buyers to cancel the BCH/USD decline and the development of the downward trend will result in an upward trend. The purpose of this movement is the area close to the demand level of $250. The prudent area for Bitcoin Cash sales is located near the upper limit of the Bollinger Bands indicator at a supply level of $650.
BCH/BTC Market
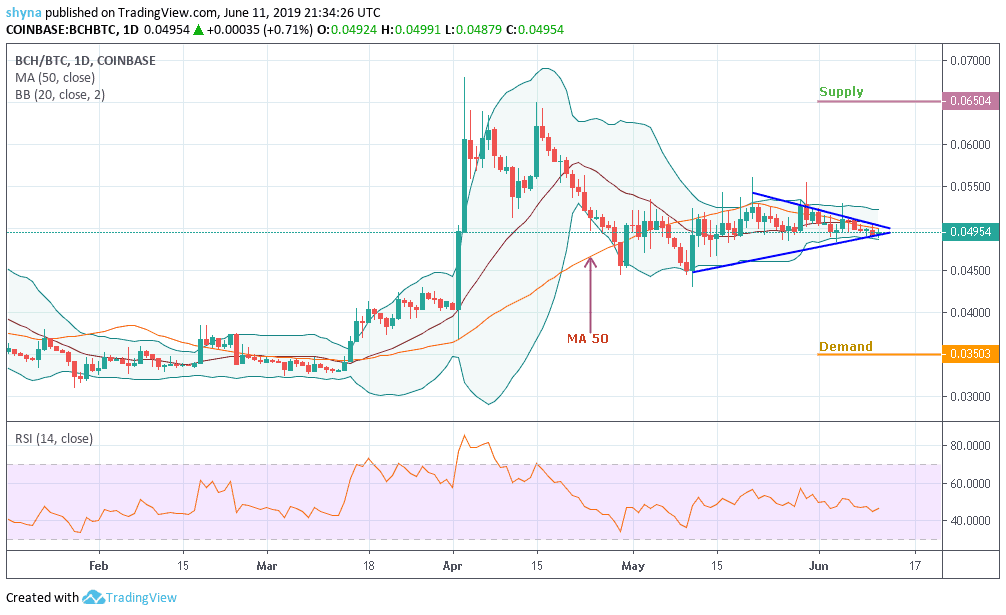
With Bitcoin comparisons, the market has evolved for a while in a very different way. But currently, sellers and buyers are trying to decide who will control the market while trying to break the lower limit of the Bollinger Bands and falling below the MA 50 (orange line) while the RSI 14 is maintaining the level 45.

However, if the bears succeed in the broken price, one would expect the market to fall to demand level 0.035BTC and 0.030BTC. Meanwhile, a rebound could increase the 0.065BTC and 0.070BTC increases where the channel is located. If the scenario is not done, the market will continue to respect the trend line.
Please note: Insidebitcoins.com is not a financial advisor. Do your own research before investing your funds in any financial asset or presented product or event. We are not responsible for your investing results.
Join Our Telegram channel to stay up to date on breaking news coverage


