Join Our Telegram channel to stay up to date on breaking news coverage
Bitcoin Price Prediction – February 17
Sequence to a recording of a rebounding motion in the BTC/USD trade operations, the crypto-economic market currently moves in ranges of $45,000 and $40,000 lines. $44,195 and $42,944 have been the value-points between price has been trading since the commencement of trading activities today as the percentage rate is at 1.24 negatives.
BTC/USD Market
Key Levels:
Resistance levels: $45,000, $47,500, $50,000
Support levels: $40,000, $37,500, $35,000
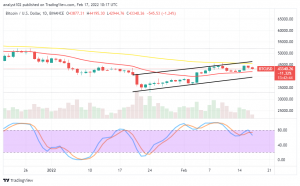
BTC/USD – Daily Chart
The BTC/USD daily chart showcases the crypto market moves in ranges of $45,000 and $40,000 after the emergence of a bullish candlestick during the February 4th session. The 50-day SMA trading indicator is around the higher resistance level above the 14-day SMA trading indicator. Variant candlesticks characterized the pattern for range-bound moving styles caged between the SMAs. The Stochastic Oscillators have crossed southbound from the overbought region slightly against the range of 80.
Can there be a sudden breakout at the $45,000 resistance trading level as the market moves in ranges?
A sudden breakout at the $45,000 resistance trading level may lack the potency of sustainability in the long run based on the fact that the bearish cycle trading session is still fresh as the BTC/USD market moves in range. It may take a while before long-position takers can get decent position entry, while an oversold reading condition of the trade at a lower zone will give a close sight of when it’s about to happen afterward.
On the downside of the technical analysis, the BTC/USD market short-position takers may keep holding their stances firm around the $45,000 level. Some barriers set up between the value line and a higher value-line around $47,500, or an extension of the $50,000 level. Traders intending to short this market may have to be on the lookout until an active reversal force emerges from a higher trading spot to launch a sell order.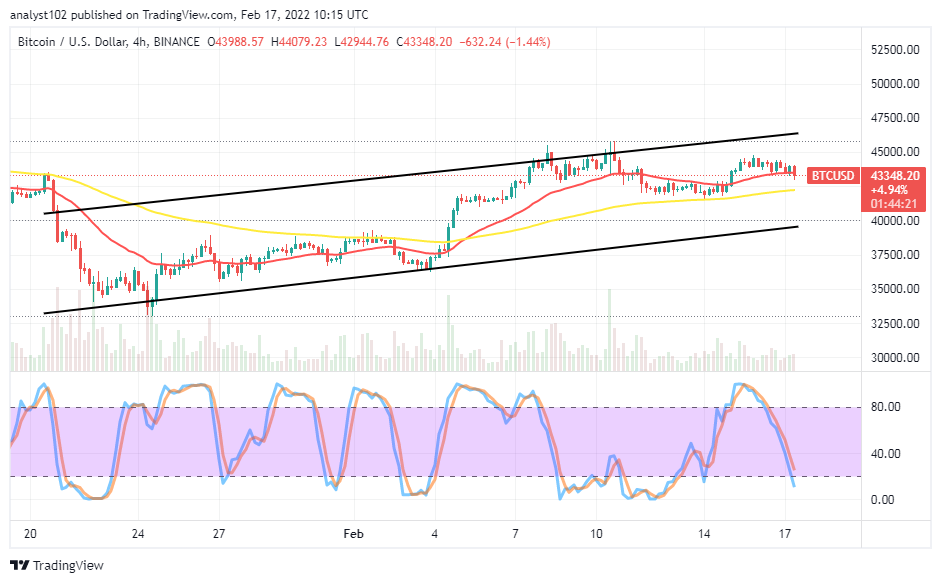
BTC/USD 4-hour Chart
The BTC/USD 4-hour chart exhibits the crypto-economic market moves in ranges of $40,000 and $45,000 as the smaller SMA trend line features closely around the emergencies of variant candlesticks. The 50-day SMA indicator is underneath the 14-day SMA indicator. The bullish channel trend lines drew northward to embody the crypto trading condition has been in a rebounding manner. The Stochastic Oscillators have crossed their lines southbound from the overbought region, slightly into the oversold region, signifying that a falling force is in place. However, the current emergence of candlesticks over several hours doesn’t suggest much difference against the ranging trend presently.
(function() { var d=document,w=window;var cS=d.currentScript || (function (){var s = d.getElementsByTagName(‘script’);return s[s.length – 1];})(),i = (function() {var s = cS.previousElementSibling;while (s) {if (s.matches(‘iframe’)) return s;s = s.previousElementSibling;}})(),iW = i.contentWindow,u = parseInt(d.body.getAttribute(‘_iL’) || 0) + 1; i.setAttribute(‘u’, u); i.onload = function() {iW.postMessage({u:u},’*’);}; if (!d.body.getAttribute(‘_iL’)) { w.addEventListener(‘message’, function (e) { if (e.data.hasOwnProperty(“u”)) { var it = d.querySelector(‘iframe[u=”‘+e.data.u+'”]’); if (it) { if (e.data.hasOwnProperty(“h”)) { it.style.height = e.data.h + ‘px’; } else if (e.data.hasOwnProperty(“w”)) { it.style.width = e.data.w + ‘px’; } } } }); } d.body.setAttribute(‘_il’, u); })();
Join Our Telegram channel to stay up to date on breaking news coverage