Join Our Telegram channel to stay up to date on breaking news coverage
Bitcoin (BTC) Price Prediction – September 21, 2020
Bitcoin reaches a high of $11,174 but retraced to a $10,812 low. After retesting the $11,000 resistance, BTC/USD plunged to the low of $10,321. Today, the BTC price has corrected upward and it is trading at $10,531 at the time of writing.
Resistance Levels: $10,000, $11, 000, $12,000
Support Levels: $7,000, $6,000, $5,000
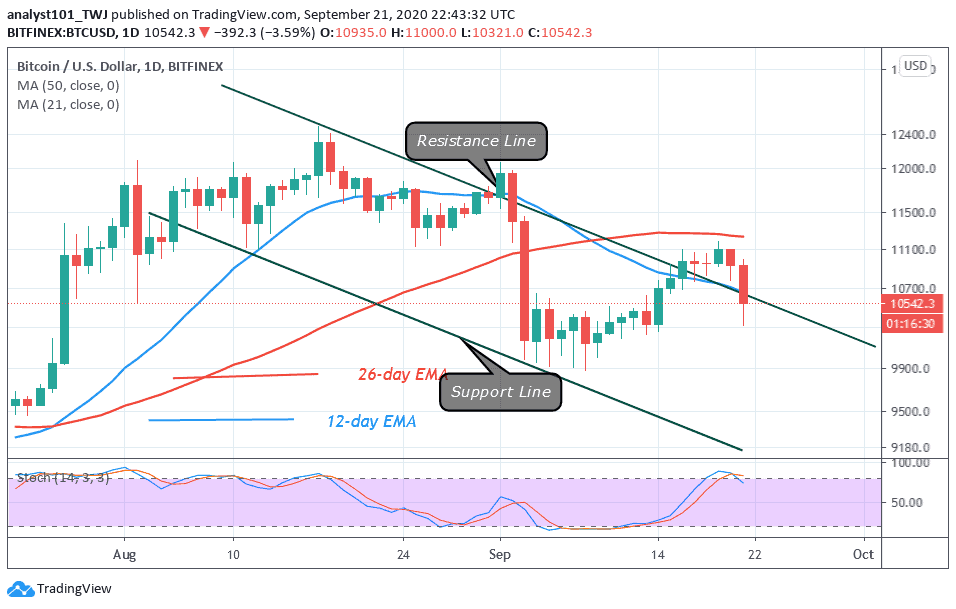
Today, Bitcoin has fallen to the $10,000 psychological support level after failing to break the $11,000 overhead resistance. The bulls push BTC to the highs of $11,041 and $11,174 but failed to sustain the uptrend above the $11,000 resistance. The buying pressure dries up at a higher price level. Sellers overwhelming overpowered the bulls above the $11,000 resistance.
The bears have succeeded to push BTC price to the $10,000 support. Sellers may attempt to push BTC price beyond the $9,800 support level. In early September, several attempts were made by the bears to break the $10,000 support but to no avail. On the downside, if the bears succeed in breaking the $10, 000 and $9,800 support, BTC will drop to $9,400 and subsequently reach the low of $9,000. Conversely, if the $10,000 support holds, Bitcoin will resume the upside momentum. Today, the price action is still showing bearish signals.
Bitcoin Indicator Reading
The coin is below the 80% range of the daily stochastic. It indicates that the coin is in a bearish momentum. BTC price has also broken below the EMAs signaling the resumption of a downward move. The price broke below the resistance line of the descending channel. BTC price has fallen into the channel to trade in a descending channel.
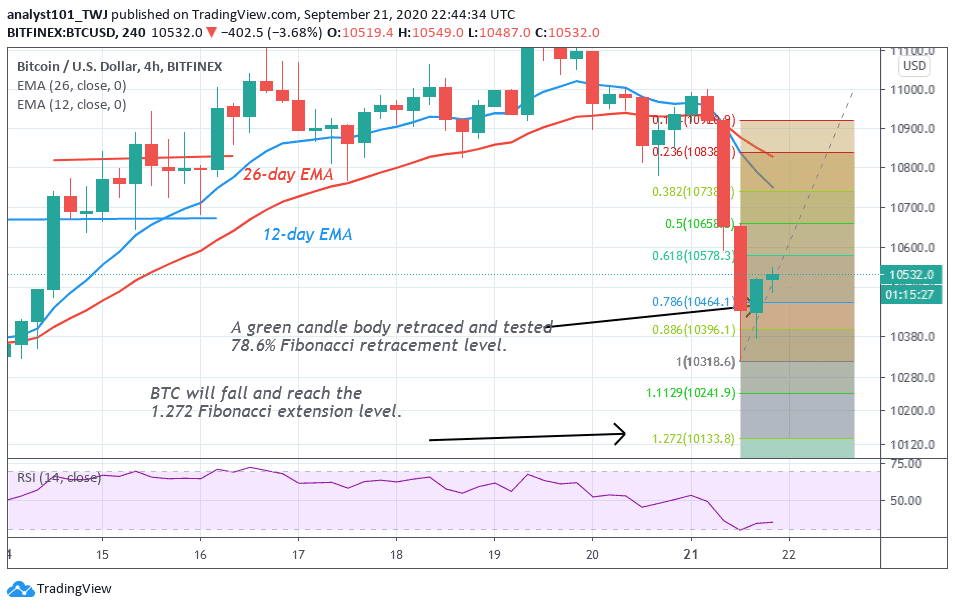
After the recent crash, Bitcoin fell to a low of $10,312 and resumed upward. The price retested the $10,500 high and continued the downward move. In the last bearish impulse of September 21, the retraced candle body tested the 78.6% Fibonacci retracement level. It indicates that the coin will fall to the low at 1.272 Fibonacci retracement level. That is the coin will fall to the low of $10,133. At the 1.272 Fibonacci extension level, the BTC price will reverse to the 78.6% retracement level where it originated.
Join Our Telegram channel to stay up to date on breaking news coverage