Join Our Telegram channel to stay up to date on breaking news coverage
Bitcoin (BTC) Price Prediction – November 3, 2020
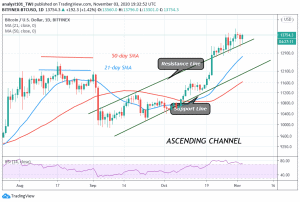
BTC/USD now fluctuates between $13,060 and $14,000. This is because of the inability of buyers to push BTC above $14,000 high. The king coin suffers a bearish reaction, each time an attempt is made at the resistance.
Resistance Levels: $13,000, $14,000, $15,000
Support Levels: $7,000, $6,000, $5,000

Following its impressive moves in the past few days, BTC is now confined in a range. Presently, BTC is finding penetration difficult at the $13,800 resistance. On November 1 and 3, BTC was repelled as price slumped to $13,225 and $13,305 lows from the recent high. Th crypto is currently trading at $13,732 at the time of writing. For example, a strong bounce above $13,700 will propel the price to break the $13,800 resistance and the momentum will extend to retest the resistance at $14,000. On the downside, a break below $13,060 support will cause the coin to drop to $12,900 and $12,100. This will indicate a sign of weakness of the coin
Bitcoin Indicator Analysis
Bitcoin is above the 80% range of the daily stochastic. It indicates that the market is in the overbought region. Similarly, BTC is trading above 70% of the Relative Strength Index period 14. It also indicates that BTC is in the overbought region of the market. The market is trending despite the overbought conditions. Bitcoin is also said to be in a strong bullish momentum. The price bars are well above the SMAs which are pointing northward. This indicates that BTC is rising.
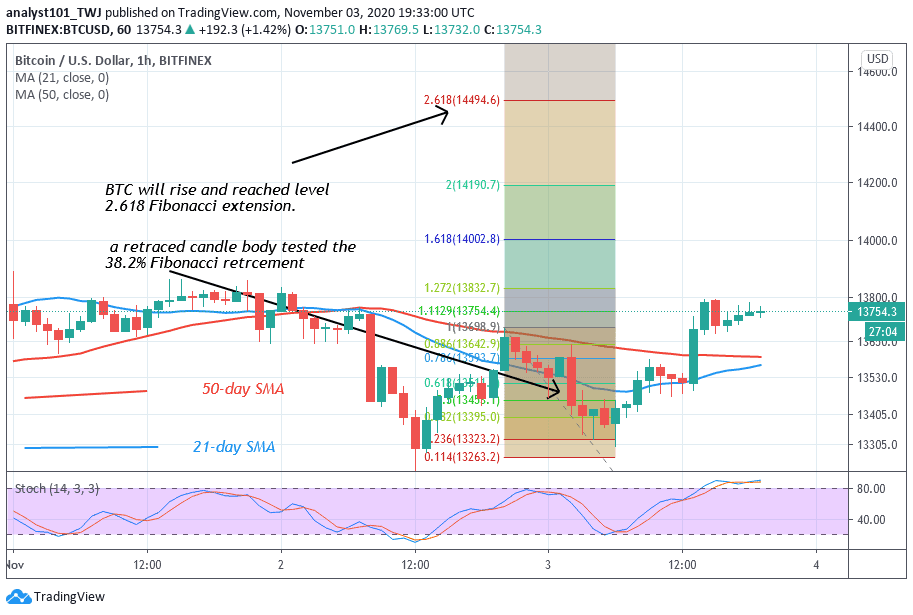
Meanwhile, BTC’s upward move is being resisted at the $13,800 high. A break above the resistance will accelerate price movement. On November 2 uptrend, a retraced candle body tested the 38.2% Fibonacci retracement level. This indicates that Bitcoin will rise and reach level 2.618 Fibonacci extensions. That is the high of $14,494.60.
Join Our Telegram channel to stay up to date on breaking news coverage