Join Our Telegram channel to stay up to date on breaking news coverage
Bitcoin (BTC) Price Prediction – April 26, 2021
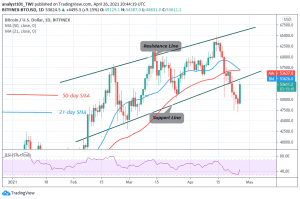
On April 23, Bitcoin decline to $47,500 low and resumed fluctuations above the current support. The bulls attempted to push BTC/USD price above the $54,000 resistance but were repelled. Bitcoin is falling because of the recent rejection at the $54,000 high.
Resistance Levels: $65,000, $70,000, $75,000
Support Levels: $50,000, $45,000, $40,000
Bitcoin bulls made frantic efforts to push BTC price above the $54,000 resistance but failed. The king coin had earlier fallen to $47,500 low as bulls buy the dips. Failure of the bulls to break the recent high will compel Bitcoin to be range-bound between levels $47,500 and $54,000 price levels. On the upside, if buyers break the resistance at $54,000, Bitcoin will rally to the previous highs. Nonetheless, if price rallies above $58,000 support, Bitcoin will resume upside momentum. Conversely, if the bullish scenario fails, sellers may want to breach the $47,500 support level. However, the market will decline to $43,000 or $41,000 low, if Bitcoin loses the current support. Bitcoin price is falling as it reached the low of $53,293.
Bitcoin (BTC) Indicator Reading
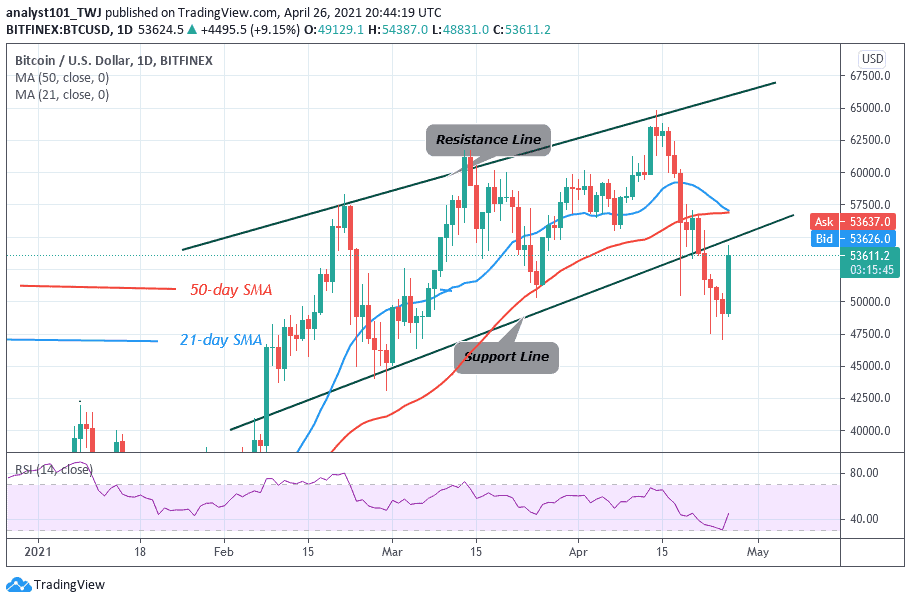
BTC price is in the bearish trend zone as it is below the 21-day and the 50-day SMA. This suggests the possibility of a price fall. Buyers have to push price above the SMAs for the resumption of upside momentum. The Relative Strength Index period 14 has confirmed that Bitcoin is in the bearish trend zone as it is at level 43. The market is below the centerline 50 which means further downsides likely. Bitcoin is above the 80% range of the daily stochastic. It indicates that the coin is in the overbought region and perhaps may fall.
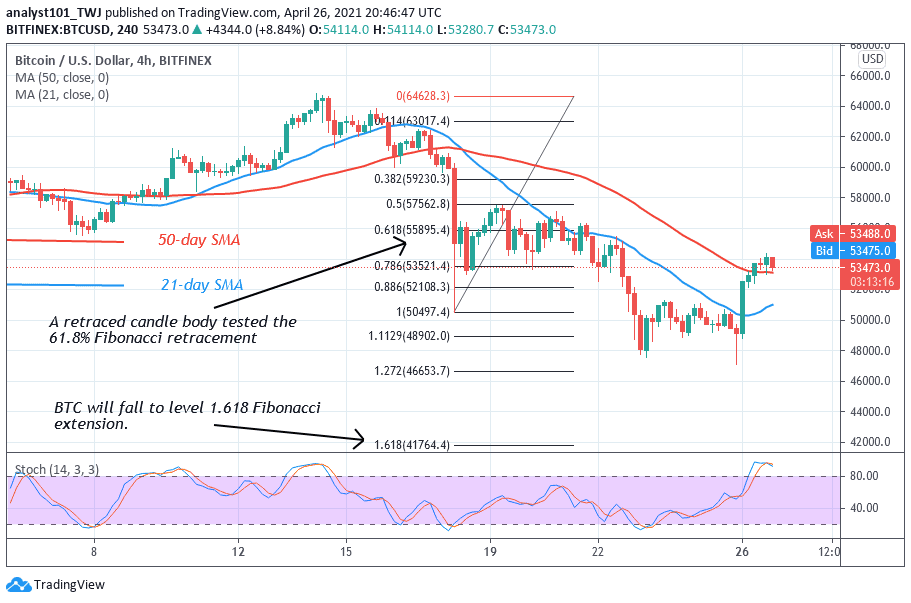
Bitcoin is in a downward move as the market is range-bound between level $47,500 and $54,000. The Fibonacci tool analysis will hold if the bears break the $47,500 support. On April 18 downtrend; a retraced candle body tested the 61.8% Fibonacci retracement level. The retracement implies that Bitcoin will fall to level 1.618 Fibonacci extension or the low of $41,764.40
Join Our Telegram channel to stay up to date on breaking news coverage