

Join Our Telegram channel to stay up to date on breaking news coverage
Bitcoin (BTC) Price Prediction – April 5, 2021
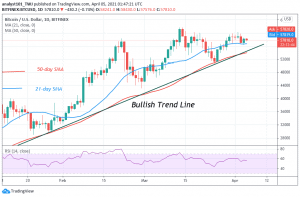
BTC/USD has not fared well in March. For instance, since March 14, buyers have failed to break the $60,000 psychological price level. The king coin has been in a downward correction for over three weeks. Buyers have not been able to push BTC beyond $61,693. This is a clear indication that the bears are defending the $60,000 and $61,693 price levels.
Resistance Levels: $58,000, $59,000, $60,000
Support Levels: $40,000, $39,000, $38,000

Since March 30, the BTC price has been consolidating below the $60,000 resistance. Incidentally, this led to the retesting of the overhead resistance. The retesting of the overhead resistance is possible if price is stable above the crucial support at $58,000. Nonetheless, the bulls have repeatedly lost this crucial support which is why the overhead resistance is yet to be broken. Presently, BTC price is fluctuating between $57,000 and $60,000 price levels.
The bulls are currently defending the $57,000 support which has been tested twice. Today, Bitcoin is trading at $57,590 at the time of writing. Sellers have succeeded in breaking the $58,000 support. On the downside, if the bears break the $57,000 support, the selling pressure may extend to $54,000 low. Nevertheless, if the $57,000 support holds, the upside momentum will resume. Nonetheless, sellers will want to push the BTC price to $51,000 low anytime buyers fail to clear the $60.000 overhead resistance.
Bitcoin (BTC) Indicator Reading
The king coin is presently above the 80% range of the daily stochastic. Also, the stochastic bands are sloping below the 80% range. This implies that Bitcoin has been trading in the overbought region of the market. Bitcoin is in a bearish momentum as sellers emerge to push prices down. The crypto’s price is above the moving averages. BTC price is at level 55 of the daily Relative Strength Index period 14. This indicates that the coin is in the bullish trend zone and capable of rising on the upside.
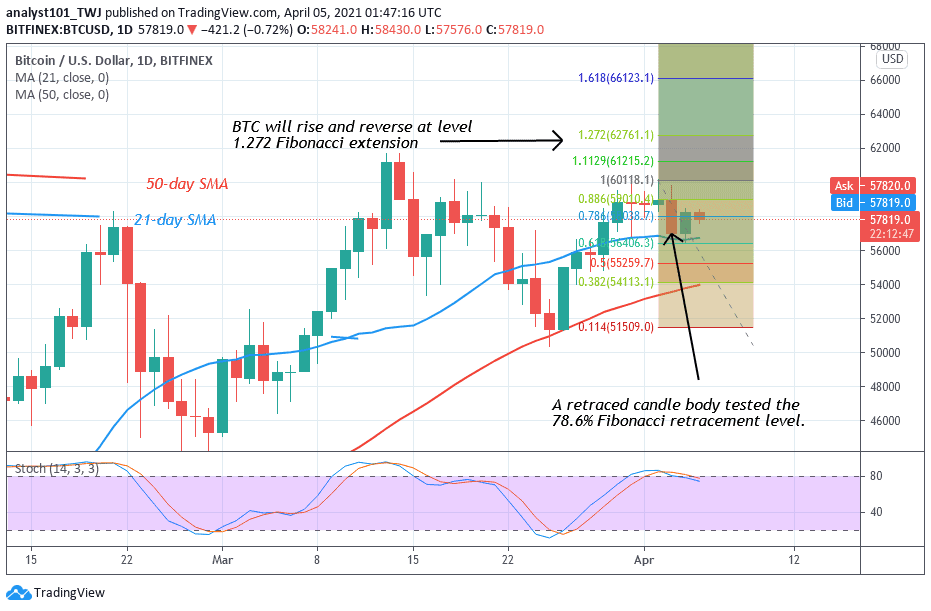
Buyers have made repeated failures to break the $60,000 overhead resistance. The Fibonacci tool has indicated a possible move above the overhead resistance and eventual reversal of BTC price. On April 2 uptrend, Bitcoin rose to $60,190 and was resisted; a retraced candle body tested the 78.6% Fibonacci retracement level. This indicates that Bitcoin will rise to level 1.272 Fibonacci extension or the high of $62,761.10 and reverse.
Join Our Telegram channel to stay up to date on breaking news coverage
