Join Our Telegram channel to stay up to date on breaking news coverage
Bitcoin (BTC) Price Prediction – March 6, 2021
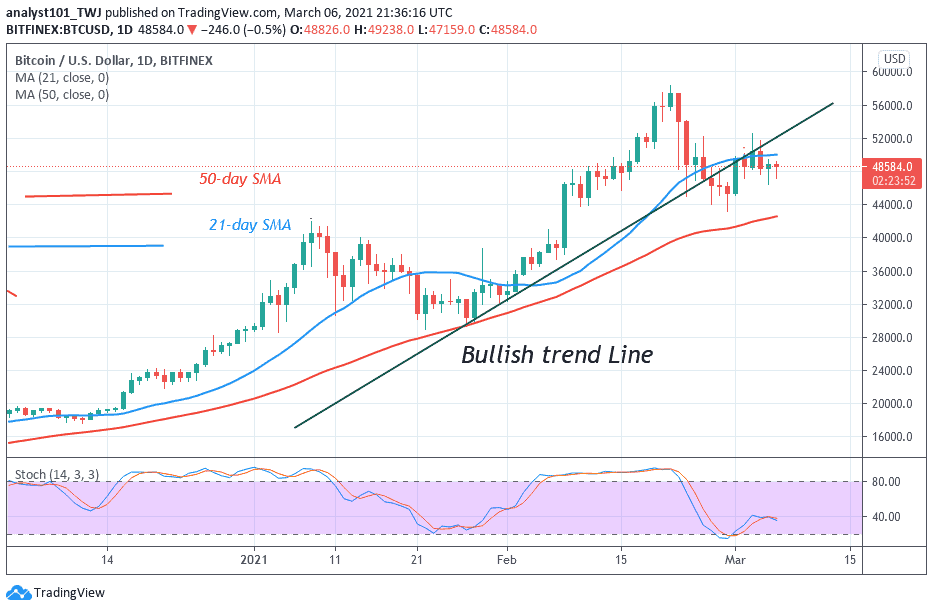
On May 3, buyers pushed above the psychological price level as BTC/USD price rallied to $52,000 high. The bulls could not sustain the bullish momentum above the $52,000 high. There was a bearish reaction as Bitcoin dropped to $46,417.00 low.
Resistance Levels: $58,000, $59,000, $60,000
Support Levels: $40,000, $39,000, $38,000

Following the rejection from the $52,000 resistance, BTC price fell to $46,000 support and price corrected upward. The upward correction was terminated at $49,361 as the BTC price drops again to the support at $47,000. As Bitcoin faces rejection from the recent high, there is the likelihood of the bulls recouping to resume upward move. However, as the price continues its fluctuations, the current support at $46,000 can be broken by the bears. On the downside, Bitcoin is likely to decline to $41,000 low, if the current support is breached. On the upside, if the bulls break the $52,000 resistance, Bitcoin will resume upside momentum. A rally above $58,000 is likely. Bitcoin is at level 50 of the Relative Strength Index Period 14. It indicates that there is a balance between supply and demand.
Bitcoin Potential Growth Is Likely Between $75k and $306k, Kraken Research
According to the historical data of Bitcoin dating back to 2011 suggests that the coin’s price could rise somewhere between $75,000 and $306,000, by Kraken’s research. From the data in 2021, the first quarter of 2021 has been the third-best performing quarter in Bit coin’s 12-year existence. However, according to Kraken’s research March has been a bad month for Bitcoin’s 12 –year existence. In the past, March has, on average, underperformed February growth by 11%. Presently, Bitcoin is now trending like the first quarter of 2013; which is regarded as the most fruitful Q1 in the coin’s history.

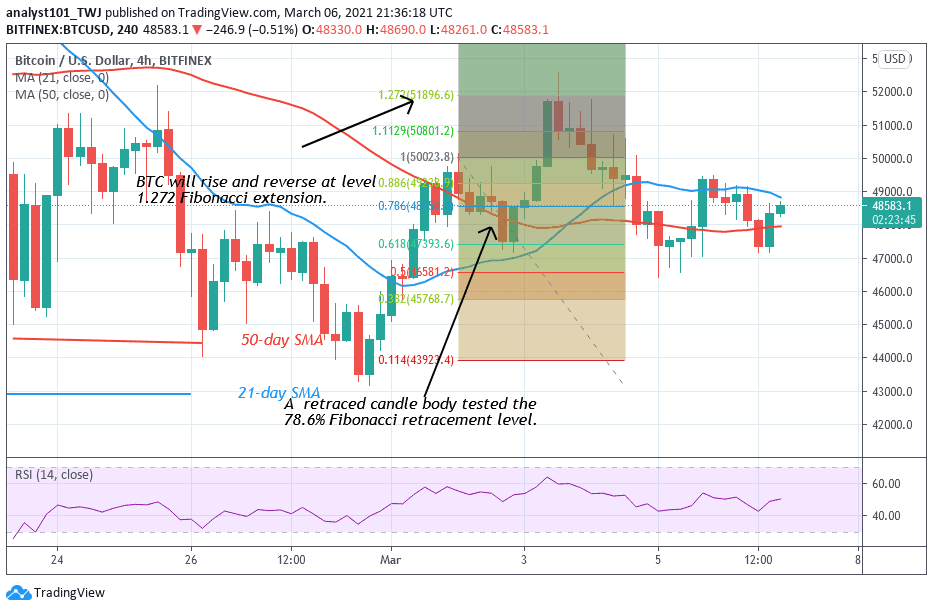
Meanwhile, Bitcoin price is fluctuating between $46,000 and $52,000 after the recent rejection. On March 2 uptrend; a retraced candle body tested the 78.6% Fibonacci retracement level. The retracement indicates that Bitcoin will rise to level 1.272 Fibonacci extensions or the high of $51,896.60. Nevertheless, Bitcoin will reverse at the recent high to the 78.6% Fibonacci retracement level where it originated. From the price action, the market has already reversed.
Join Our Telegram channel to stay up to date on breaking news coverage

