
Join Our Telegram channel to stay up to date on breaking news coverage
BNB/USD
From 15th of December last year when the prices of almost all major cryptocurrencies ended their downfall a bullish period started. Since then we have seen a strong bullish momentum to the upside that ended around 24th of December when another corrective period was seen until 8th of February when another bullish upswing has started and lasted until 24th of February in the case of Bitcoin trading, before starting a similar corrective structure like seen after 24th of December.
As the altcoins have been mostly following the price of Bitcoin, most charts have been showing a similar pattern, but not Binance coin. From the 15th of December the price of Binance coin has been nothing but rising and it came up from $4.4777 at its lowest point to $17.7765 at its highest point on 24th of March which was an increase of 297%.
Considering the amount of the increase seen it is worth saying that BNB has gained the 7th place according to its market cap as the other cryptos have been hovering around the same levels or have been corrective while the price of Binance coins increased.
From 24th of March until yesterday a minor downtrend developed which cause the price to decrease for around 11.65% coming from the mentioned high to $15.6843 at its lowest point yesterday but has started increasing again and is currently sitting at around the half range of decrease made which could be an early indication that the uptrend finally ended. 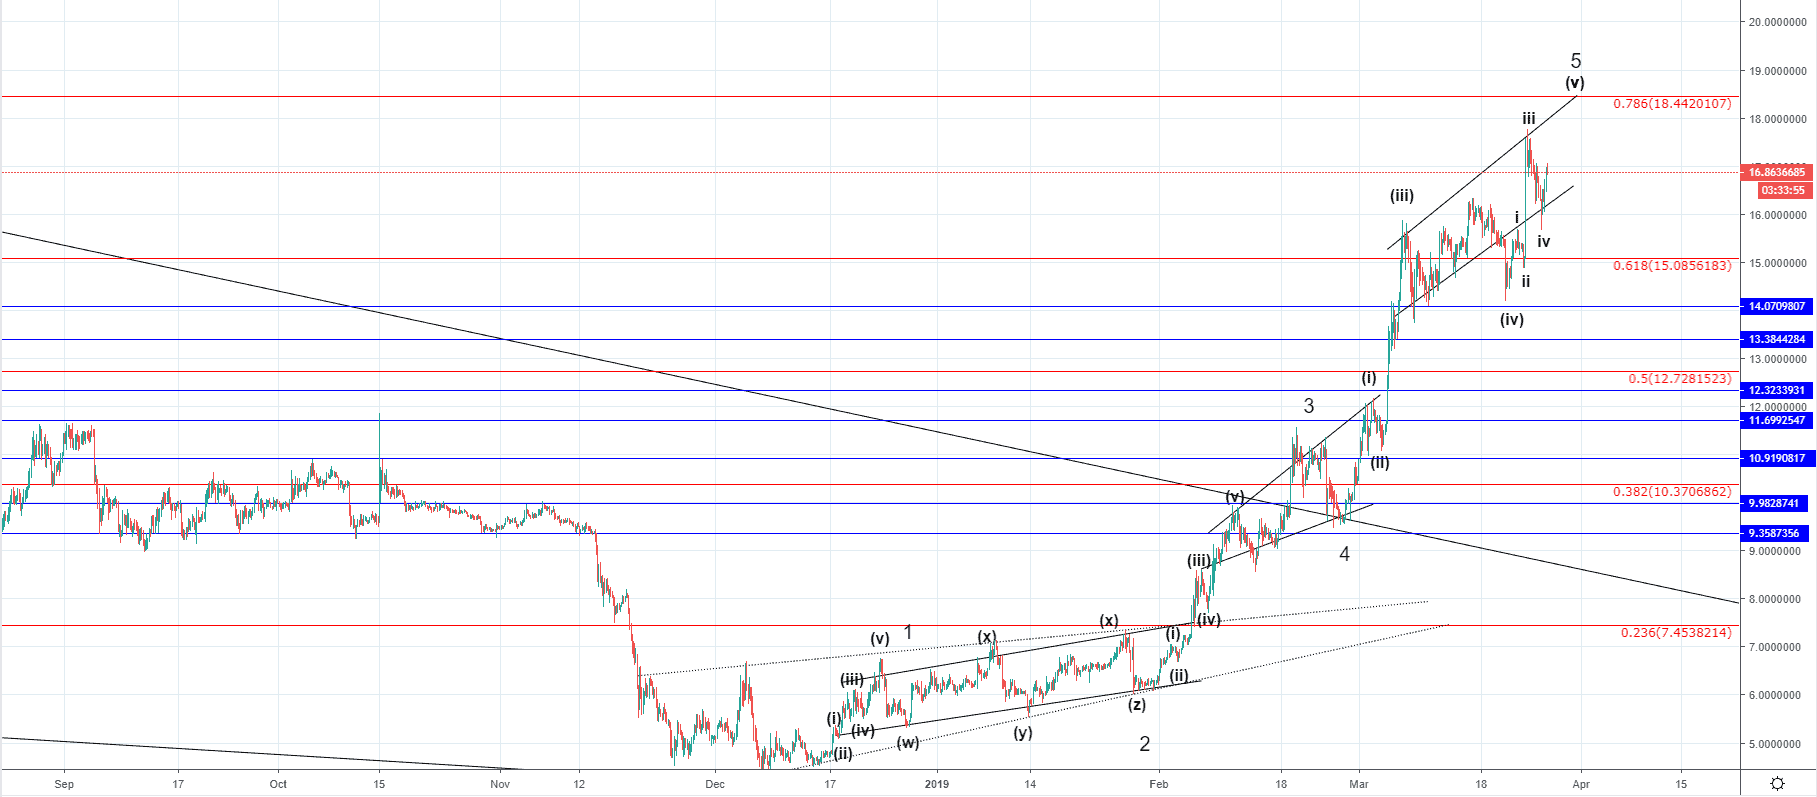
Looking at the hourly chart you can see that the price of Binance coin moved in five waves to the upside which is indicative of an impulsive move and in particular considering the amount it has increased (slightly over 297%) the move was definitely impulsive.
As I have counted the sub-waves you can see that I have projected one more run-up before the upswing ends as the Subinuette 5th wave out of the last impulsive increase should develop.
You can see that the price action formed an ascending structure of its corrective waves which is why after the 3rd Minuette wave ended another structure appeared and considering that we are most likely seeing the end of the 5th wave I could be interpreted as an ending diagonal.
As the price still has more room to go an interaction with the 0.786 Fibonacci level is expected which if occurs would bring the price up to around $18.442. The 5th Subminuette wave could end around the vicinity of the Sunday’s high, although considering the momentum unlikely.
Zooming out on to the daily chart, you can see that this impulsive move started after a three-wave correction developed from the all-time high at around $25. The price broke out from the descending triangle in which it was correcting and came to around the levels of the X wave’s ending point.
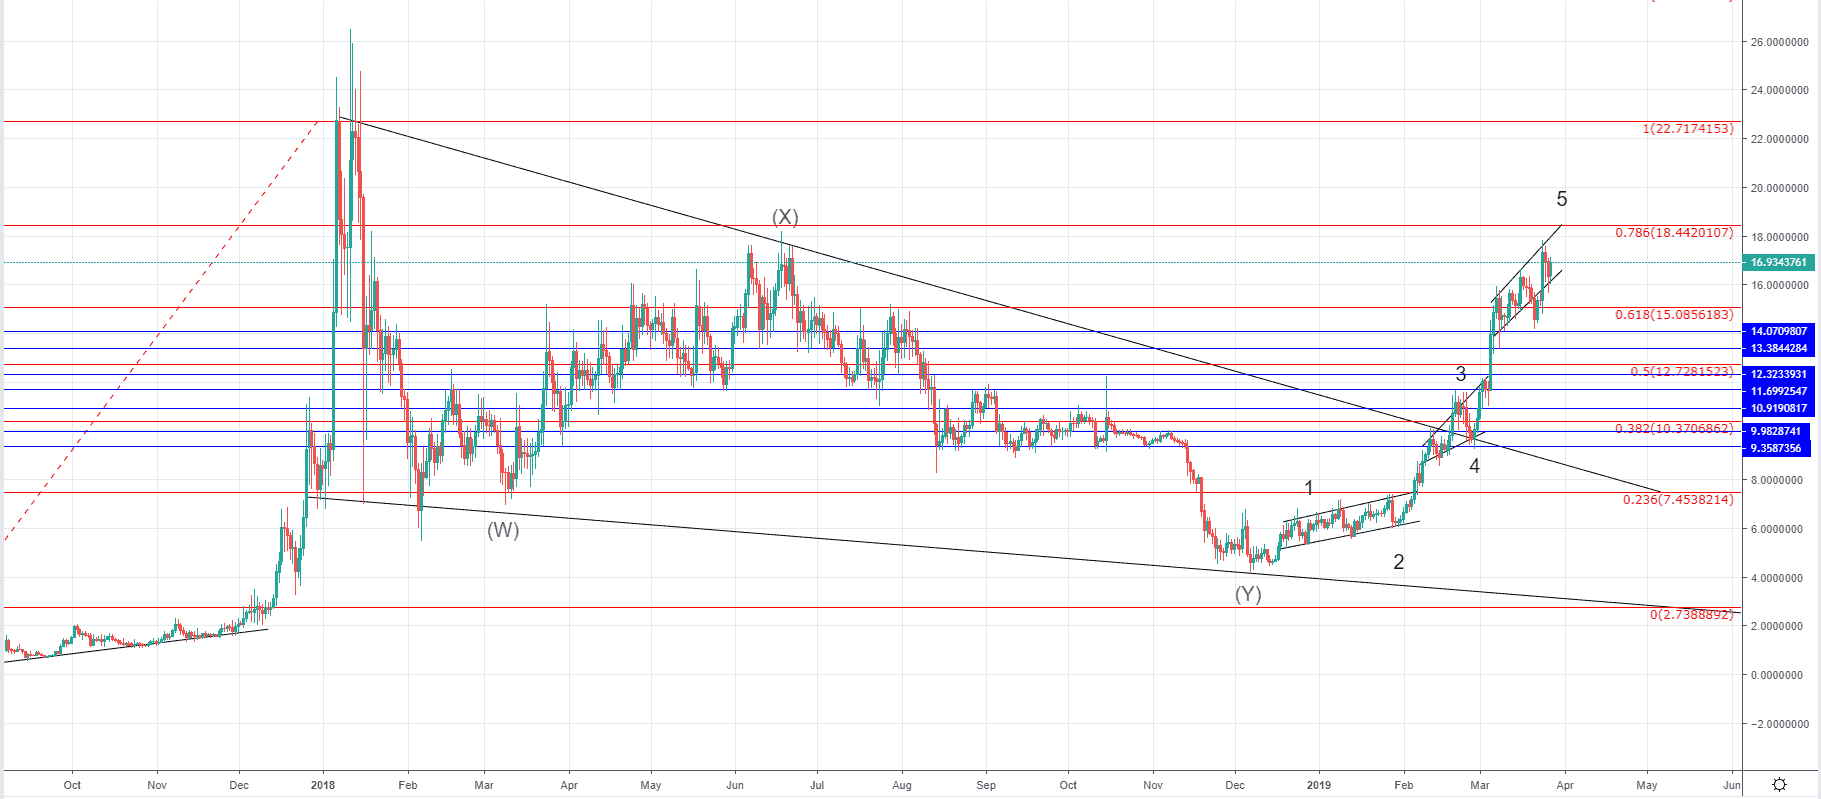
This could indicate that the correction of the price of Binance coin is over and that we are seeing the start of another increase of a higher degree that would ultimately lead to new all-time highs, or it could be the first wave of the second correction which would be the one to the upside which would mean that the price of BNB is heading further down before we see the start of an impulsive move set to form new highs.
In either way, since a trend reversal is soon expected we are to see for its momentum, depth and the wave structure of the next expected downmove which scenario would be primary.
Join Our Telegram channel to stay up to date on breaking news coverage