Join Our Telegram channel to stay up to date on breaking news coverage
BNB Price Analysis – July 6
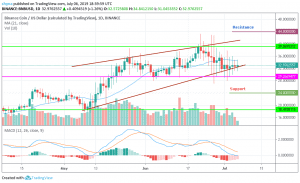
As at the time of writing, BNB prices are all over the place. By printing dojis above the main support line of $30, there is an apparent weakness. On top of that, the lack of a definitive trend direction after a solid first half of 2019 is revealing of fractures.
BNB/USD Market
Key Levels:
Resistance levels: $44, $46, $48
Support levels: $24, $22, $20
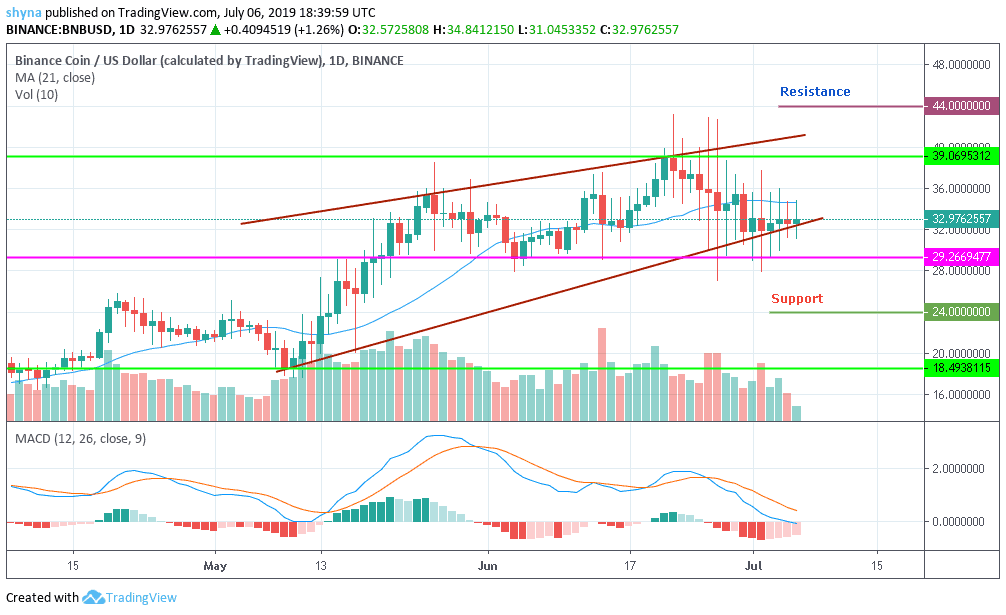
Nonetheless, despite fragilities, the path of the least resistance is northwards, the price is currently moving below the 21-day moving average and changing hands at $32. However, that is mainly dependent on whether prices will oscillate above the $30 level or even move above the $39 (June 2019 high) resistance level at the back of increasing participation.
Looking at the price from previous BNB/USD trade plans, any upswing above the resistance levels of $44, $46 and $48 could see Binance coin moving more than double to $75 level in the next few months. Conversely, going below $30 level with a differentiating breakout candlestick buoyed by ultra-high trading volumes could mean disintegration to the support levels at $24, $22 and $20 as MACD giving bearish signals.
BNB/BTC Market
Against BTC, the support at 0.0028BTC was tested and found to be slightly fragile. Resistance in this range is at 0.0042BTC, which is a technically interesting level considering the rally that started in March of this year. Volatility is increasing, and the range between 0.0026BTC and 0.0044BTC provides a place to trade between Binance announcements.
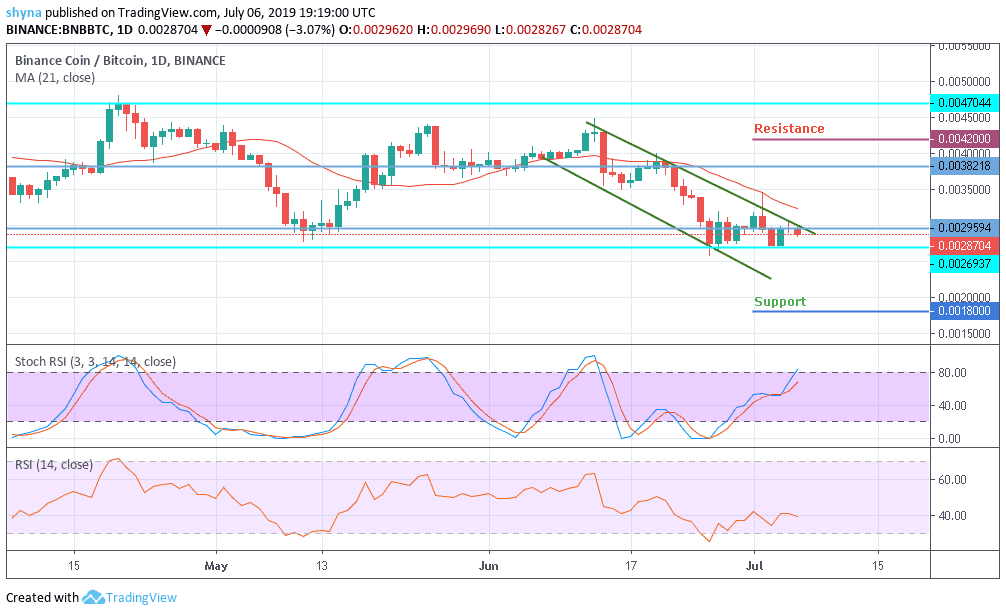
If the market follows a bullish surge, BNB may swing high to the resistance levels of 0.0042BTC, 0.0044BTC and 0.0046BTC. Crossing below the descending wedge lies the support levels at 0.0018BTC, 0.0016BTC and 0.0014BTC as well. On the Stochastic RSI, the token is currently moving towards the overbought zone. The RSI is now at the 41 level, a sign of sideways movement.
Please note: insidebitcoins.com is not a financial advisor. Do your own research before investing your funds in any financial asset or presented product or event. We are not responsible for your investing results.
Join Our Telegram channel to stay up to date on breaking news coverage