Join Our Telegram channel to stay up to date on breaking news coverage
At the moment, the Biconomy price prediction begins a progressive movement as the price moves to cross above the moving averages.
Biconomy Prediction Statistics Data:
- Biconomy price now – $0.29
- Biconomy market cap – $159.6 million
- Biconomy circulating supply – 547 million
- Biconomy total supply – 1 billion
- Biconomy Coinmarketcap ranking – #161
BICO/USD Market
Key Levels:
Resistance levels: $0.40, $0.45, $0.50
Support levels: $0.20, $0.15, $0.10

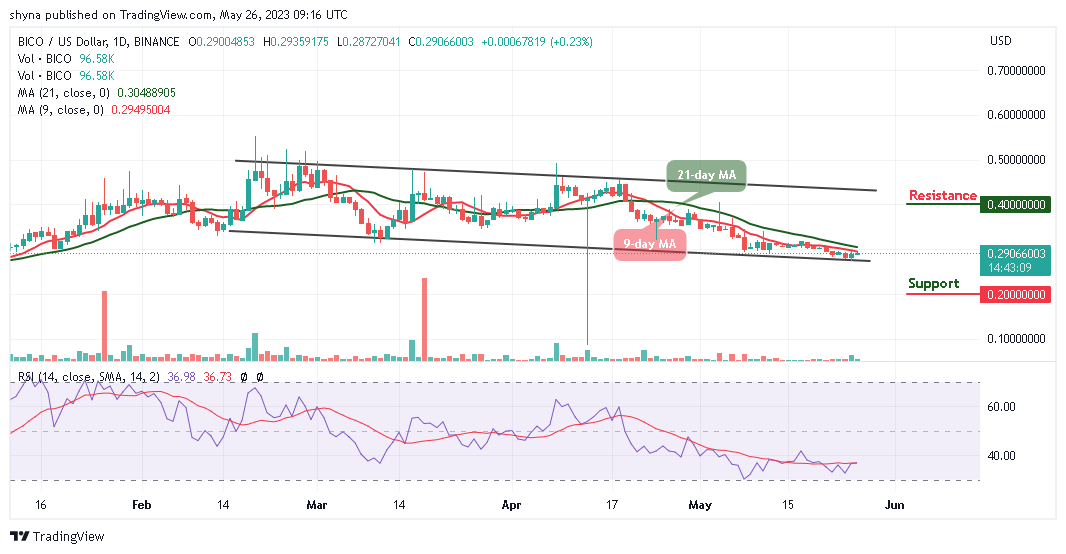
BICO/USD is moving to cross above the 9-day and 21-day moving averages as the coin moves bullishly. However, the $0.25 support level is the critical support where the price touched today. Meanwhile, the Biconomy price has earlier trades around this level before making an upward movement and this makes the support level a strong support zone.
Biconomy Price Prediction: Can Biconomy Move to the Upside?
The Biconomy price is likely to gain more if the bulls could defend the resistance level of $0.29 level; the coin may continue its upward movement by breaking above the 21-day moving average after crossing above the 9-day moving average. Therefore, any further bullish movement may take the coin to the potential resistance levels of $0.40, $0.45, and $0.50.
However, as revealed by the daily chart, the current prediction may be invalidated should the bears bring the coin below the $0.25 level, and the Biconomy price may fall to the low of $0.20, $0.15, and $0.10 support levels. Moreover, the technical indicator Relative Strength Index (14) is moving to cross above the 40-level; suggesting more bullish movements.
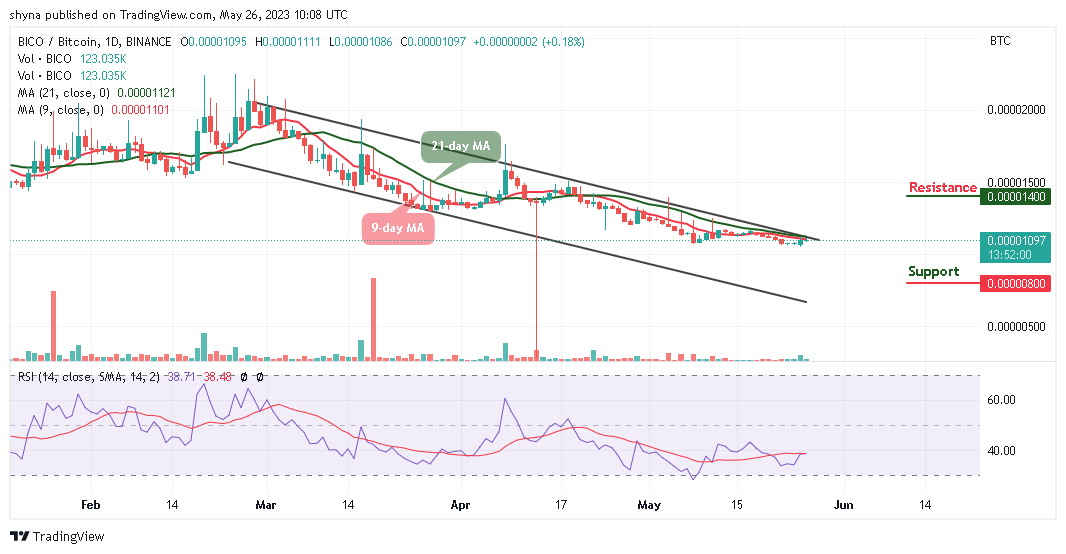
Against Bitcoin, the Biconomy price is currently trading near the 9-day and 21-day moving averages to cross above the upper boundary of the channel. However, the red line of the 9-day moving average may likely make a bullish cross above the green line of the 21-day moving average which could allow the coin to touch the nearest resistance of 1200 SAT.

Therefore, if the buyers could push the price above the mentioned resistance, higher resistance could be located at 1400 and above. Moreover, should the bulls fail to move the coin upward, the nearest support level could be located at 800 SAT and below. Moreover, the technical indicator Relative Strength Index (14) crosses above the 40-level, which indicates that buyers may begin to dominate the market.
Biconomy Alternatives
At the time of writing, the technical indicator Relative Strength Index (14) signal line is likely to cross above the 40-level, which indicates that the Biconomy price may continue to trade bullishly. Meanwhile, the 9-day MA may need to cross above the 21-day MA for the buyers to concentrate on stirring action to the north. Moreover, the AiDoge platform uses sophisticated AI algorithms to generate quality memes which are trained on meme datasets and crypto news. The AI processes the input from the user and then creates relevant and engaging memes. There’s also a public wall for sharing and voting on memes. However, the token has raised almost $12m in the ongoing presale.
Join Our Telegram channel to stay up to date on breaking news coverage


