
Join Our Telegram channel to stay up to date on breaking news coverage
The Biconomy price prediction reveals that BICO may follow the bullish movement as the coin hovers around the $46 resistance level.
Biconomy Prediction Statistics Data:
- Biconomy price now – $0.46
- Biconomy market cap – $219.7 billion
- Biconomy circulating supply – 480.9 million
- Biconomy total supply – 1 billion
- Biconomy Coinmarketcap ranking – #156
BICO/USD Market
Key Levels:
Resistance levels: $0.60, $0.65, $0.70
Support levels: $0.30, $0.25, $0.20
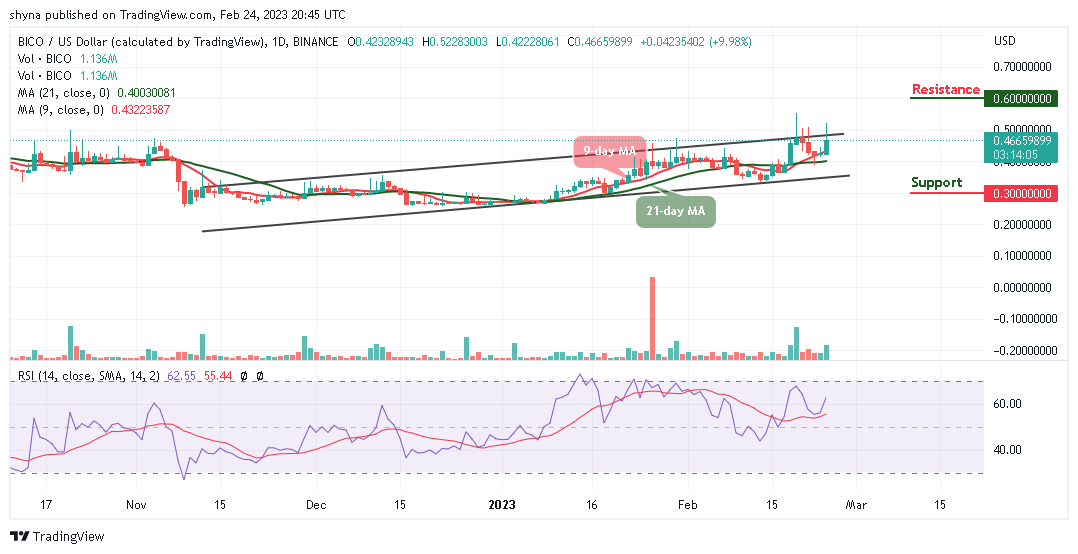
According to the daily chart, BICO/USD is likely to touch the nearest resistance level of $0.50 as the coin heads to the upside. However, traders can see that this crypto’s difficult period is over as it is trying to create a new trend. The Biconomy price is currently trading at $0.46 after touching the daily high at $0.52 above the upper boundary of the channel.
Biconomy Price Prediction: BICO/USD Gets Ready for the Upward Movement
At the time of writing, the Biconomy price is beginning to create a new uptrend. A break above the resistance level of $0.50 could encourage more buyers to increase their entries, which could later push the price toward the resistance levels of $0.60, $0.65, and $0.70. On the downside, any bearish movement below the 9-day and 21-day moving averages could gain traction with the next focus at $0.40 support.
Moreover, if the above mentioned-support is broken, the downside pressure may increase while the next support may be located at $0.30, $0.25, and $0.20. The technical indicator Relative Strength Index (14) confirms the bullish movement as the signal line crosses above the 60-level.
Against Bitcoin, the Biconomy price is above the 9-day and 21-day moving averages. Meanwhile, a daily close above the upper boundary of the channel could encourage the bulls to extend the rally towards 2400 SAT and above. In other words, a close below the 9-day and 21-day moving averages could reverse the Biconomy price direction towards the daily support at 1800 SAT.
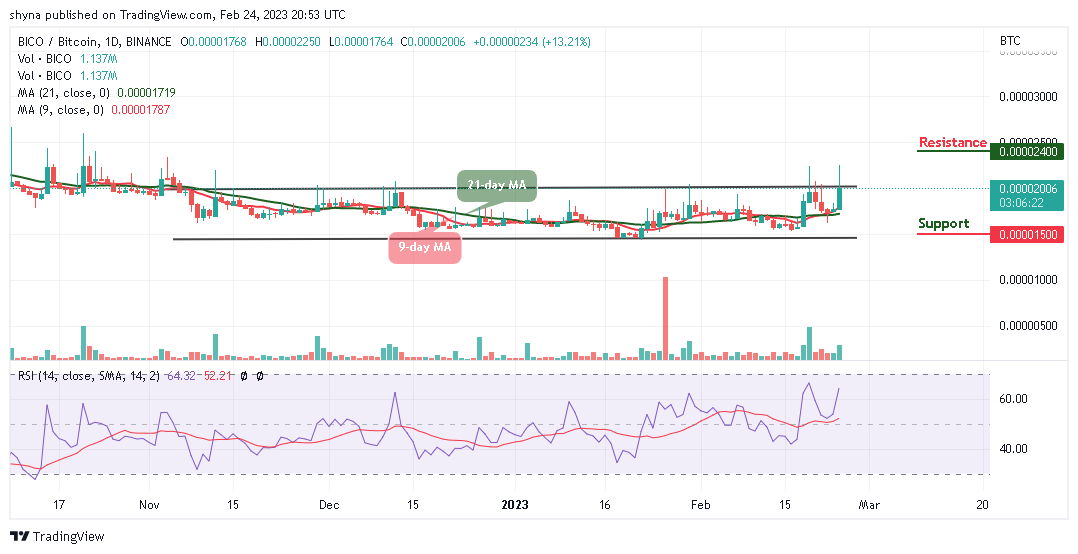
However, any bearish movement could take the coin to the support of 1500 SAT and below. Meanwhile, there is a possibility that BICO/BTC may continue the bullish trend as the technical indicator Relative Strength Index (14) crosses above the 60-level with the signal line facing up to indicate bullish movement.
Biconomy Alternatives
The Biconomy price has been exhibiting strength over the last 24 hours as the coin managed to regain above the 9-day and 21-day moving averages amid technical correction from the downward trend. Meanwhile, if bulls hold the current market value and keep the price above the moving averages, it may cross above the upper boundary of the channel. Moreover, the Fight Out (FGHT) token presale is ongoing and time is running out raising about $5 million at the moment. This new cryptocurrency offers all the tools and advice that users need to foster a healthier lifestyle.
Join Our Telegram channel to stay up to date on breaking news coverage