Join Our Telegram channel to stay up to date on breaking news coverage
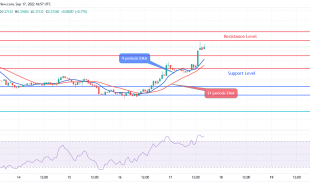
The activities of yesterday’s market took the price slightly above the $0.5000 resistance level. This price action also tested the 9-day moving average which is near the $0.5000 resistance level. later on, the selling pressure increased. At the end of the day, the price of BICO/USD closed at $0.4701 favouring the buyers. The bulls are at it again today. They are taking control of the market. However, the sellers are also formidable.
Biconomy Market Price Statistic:
- BICO/USD price now: $0.4796
- BICO /USD market cap: $ 92,165,395
- BICO /USD circulating supply: 190,954,186.73
- BICO/USD total supply: 1,000,000,000
- BICO /USD coin market ranking: #254
Key Levels
- Resistance: $0.4989, $0.5333, $0.5500
- Support: $0.4513, $0.4251, $0.4000
Your capital is at risk
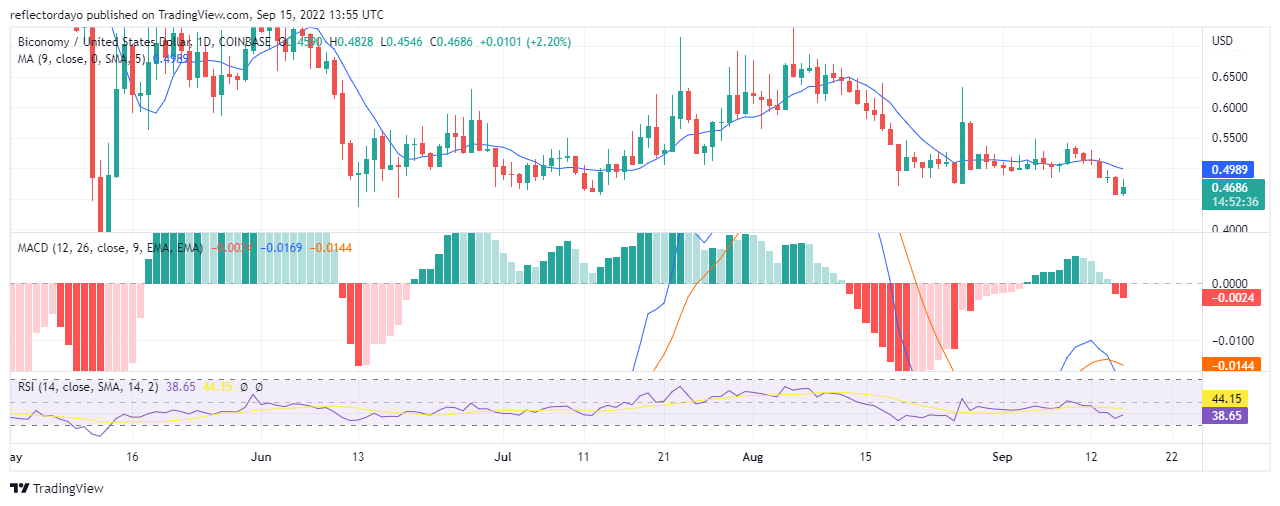
Biconomy Market Price Analysis: The Indicators’ Point of View
According to the two indicators used for this analysis, the price of Biconomy is ranging in the downtrend region. Even the 9-day moving average is above the price actions. But with the bullish momentum coming up, the faster lines of the two indicators are coming close to crossing the signal lines in each of the two indicators. This is a sign of a bullish price recovery. But in a balanced view, the bears in the market are still strong.
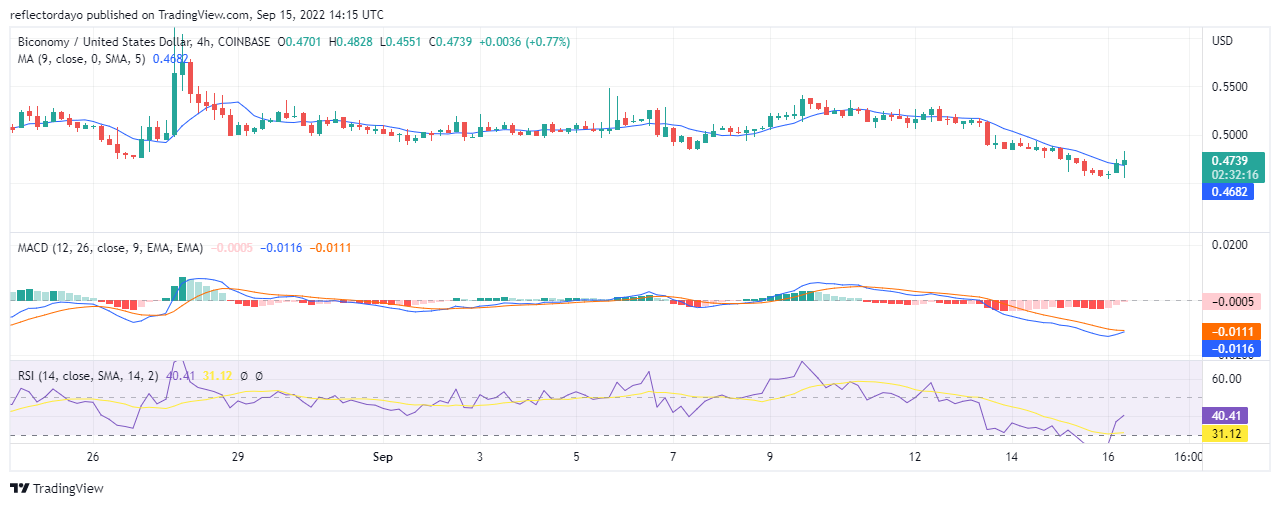
Biconomy: BICO /USD 4-Hour Chart Outlook
The bulls took total control of the first 4-hour session and this raised the price above the 9-day moving average. As far as this timeframe is concerned, the market is in an uptrend. In the MACD and RSI, the faster lines have crossed the slower lines. And the RSI line has reached 51%. In the second session, more sellers are becoming active and they are now slowing down the price up-push by the buyers. Buyers and Sellers are still in for an intense struggle.
Related
- How to Buy Tamadoge
- Visit Tamadoge Website
Join Our Telegram channel to stay up to date on breaking news coverage