Join Our Telegram channel to stay up to date on breaking news coverage
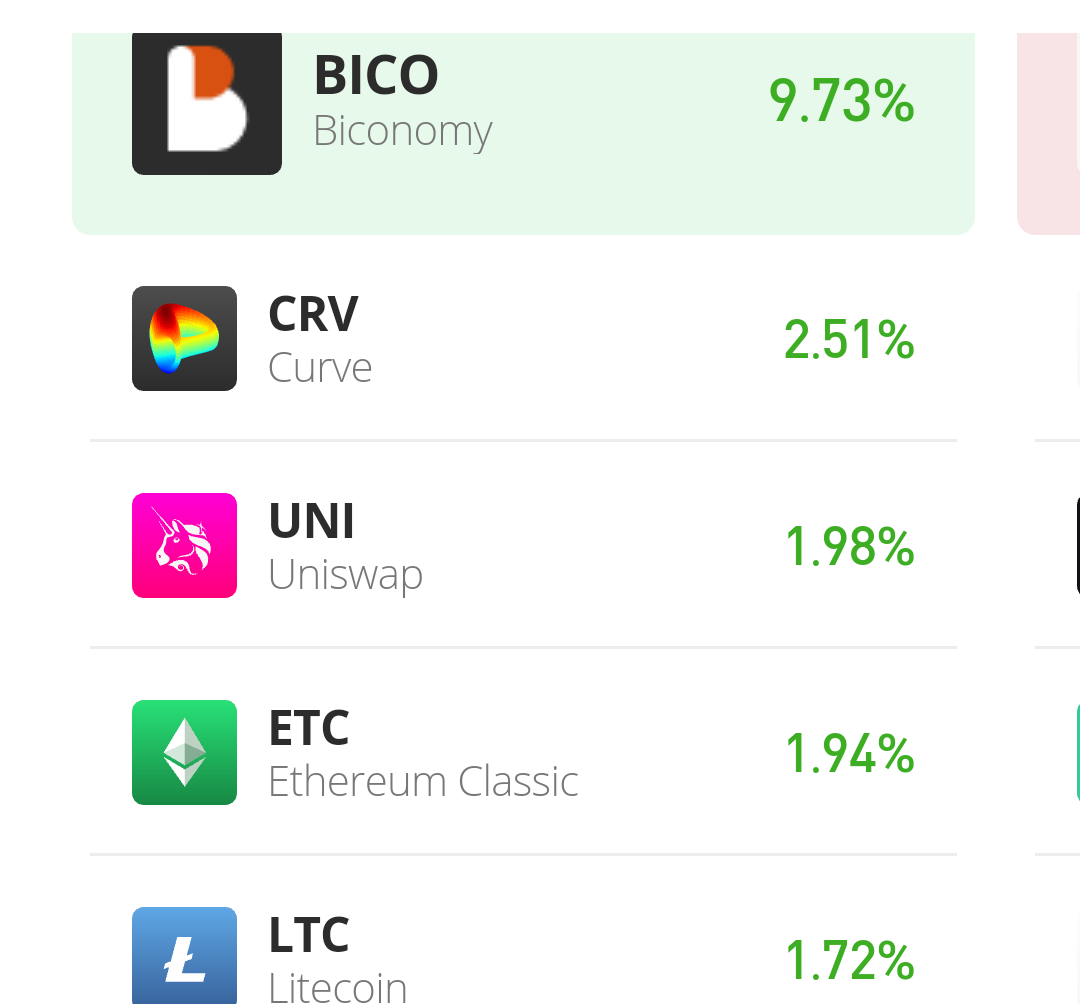
BICO displaced NEO from the top of the crypto mover list to claim the number one position. This crypto moved roughly 10% upward in value today. And, at that stands as one of the most gainful coins today. Will this coin witness more upside gain? That we’ll be answering soon.
BICO price now: 0.5816
BICO Market Cap: 751.4 million
BICO Total Supply: 100 million
BICO Rank: 61
Major Levels:
Resistance: $0.5732, $0.5780, $0.5816
Support: $0.5340, $0.5270, $0.5150
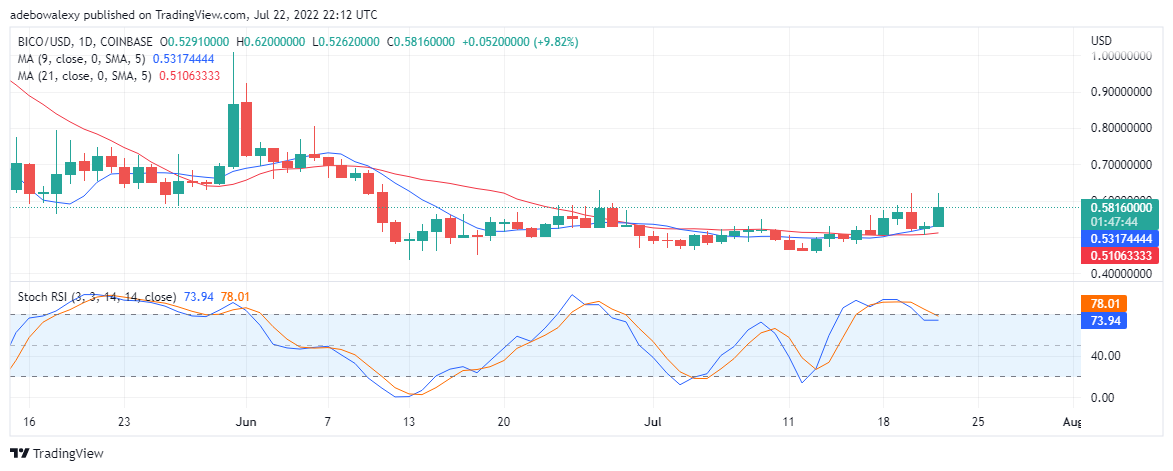
BICO/USD Value Prediction: BICO Bull Looks Tired
BICO/USD daily chart reveals signs of weakness in this crypto market. The MA (Moving Average) lines are under the price motion, however, the quicker line is attempting to cross above the last candle. The implication of this is that, once this MA line succeeds, the BICO value may have to range sideways. Consequently, this will signify a state of indecision, and traders will have to anticipate an eventual uptrend or downtrend.
Additionally, the SRSI (Stochastic Relative strength Indicator) appears to be turned sideways after a downturn. Consequently, one can expect that these indicator lines will either make an upside cross or downside cross. If these indicator lines should make an upside cross, the value of this crypto may find resistance at $0.6000, $0.6000, and $0.7000 at most. Otherwise, if these indicator lines should cross downwards, then lower supports could be found at $0.5000 and $0.4500.
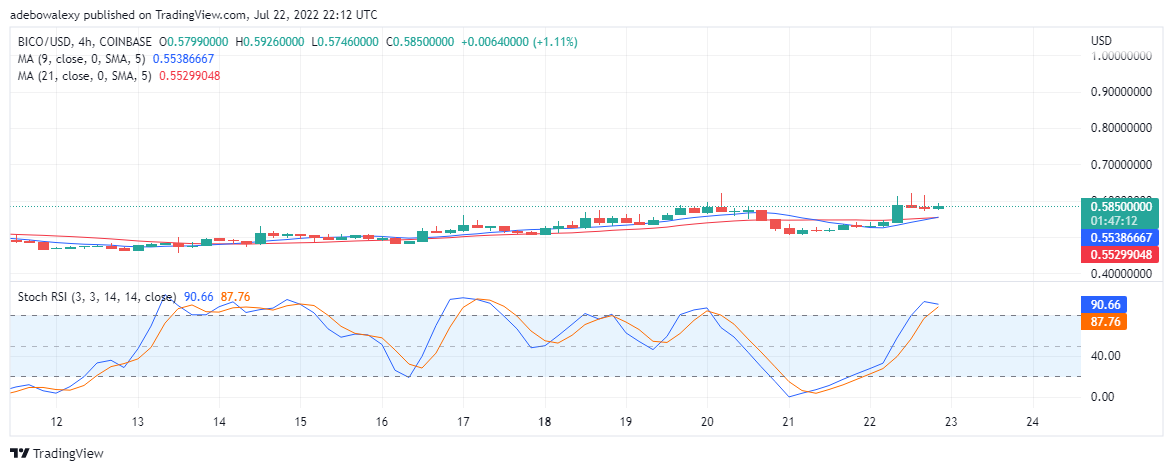
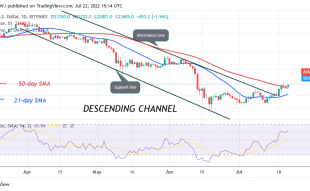
BICO/USD Value Prediction: BICO Showing More Signs of Weakness
The BICO/USD 4-hour chart Portrays more signs of weakness. Here, we can see that the MA on the chart has already crossed each other, which is what gave the last bullish candle. Also, we can see the nature of this latest candle, and we can deduce from it that the bulls and bear were in a tough contest. However, eventually, the bulls narrowly won.
This indicates that the uptrend may be near its end. Other signs include the one on the SRSI, in which the lines of this indicator are about to cross each other in the overbought area. Once this happens, the indicator lines will move downwards, and the price will fall.
Join Our Telegram channel to stay up to date on breaking news coverage