Join Our Telegram channel to stay up to date on breaking news coverage
BCH Price Prediction – April 10
Bitcoin Cash buyers defend $620 support, which results in a shallow recovery above $650.
BCH/USD Market
Key Levels:
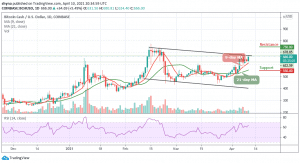
Resistance levels: $750, $800, $850
Support levels: $550, $500, $450
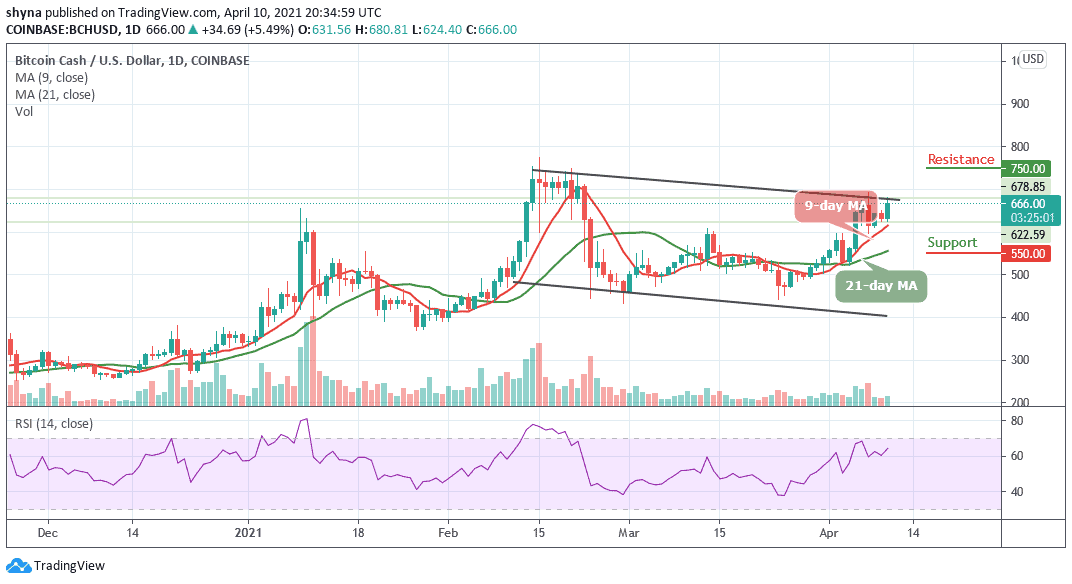
BCH/USD shifts its focus to $680 after clearing resistance at $650. Yesterday, the market was extremely down towards the 9-day and 21-day moving averages. At the time of writing, Bitcoin Cash is creating a new bullish trend and trading at $666.00 within the channel.
What to Expect from Bitcoin Cash (BCH)
BCH/USD remains above the moving averages, trading towards the upper boundary of the channel. Peradventure the market drives below the moving averages, the BCH price may likely slump to the initial support at $600, which may later bring the price to its critical supports at $550, $500, and $450. But presently, the signal line of RSI (14) moves above the 60-level and this could increase the buying pressure as the price may cross above the upper boundary of the channel to reach the $700 resistance.
However, while trading at $666, a bullish continuation could touch the resistance levels of $750, $800, and $850. Therefore, if the BCH price returns to the old support and breaks even, bears could take over the market. But as it stands, the bulls are coming up. Meanwhile, traders may expect a bullish chase within the market before any other reversal occurs.
Against BTC, the coin remains above the 9-day and 21-day moving averages today to touch the resistance level of 1138 SAT. However, Bitcoin cash is now bringing a bullish rally, the price may likely hit the potential resistance at 1300 SAT and 1350 SAT if pressure rises. In fact, the technical indicator RSI (14) is also moving above the 60-level, suggesting more bullish signals.
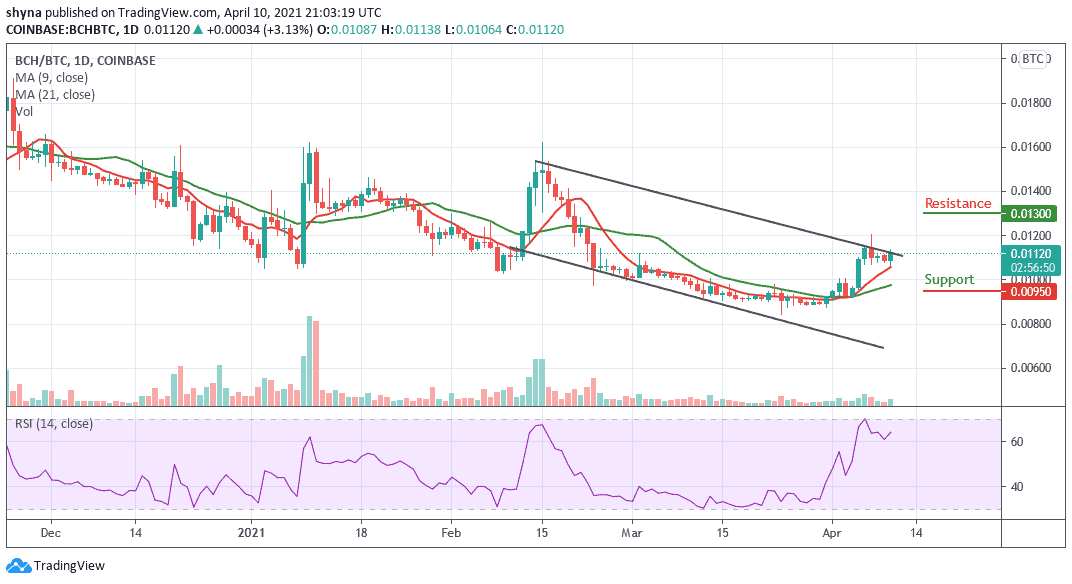
However, looking at the daily chart, it can be seen that the bulls have regained control of the market. But before the positive climb continues, BCH is likely to retrace to the break level around 1000 SAT where it may consolidate. However, should BCH/BTC drops below this consolidation area, the price could find critical supports at 950 SAT and below.
Join Our Telegram channel to stay up to date on breaking news coverage