Join Our Telegram channel to stay up to date on breaking news coverage
BCH Price Prediction – September 6
For a couple of days now, BCH/USD price actions have been consolidating around the lower boundary of the channel.
BCH/USD Market
Key Levels:
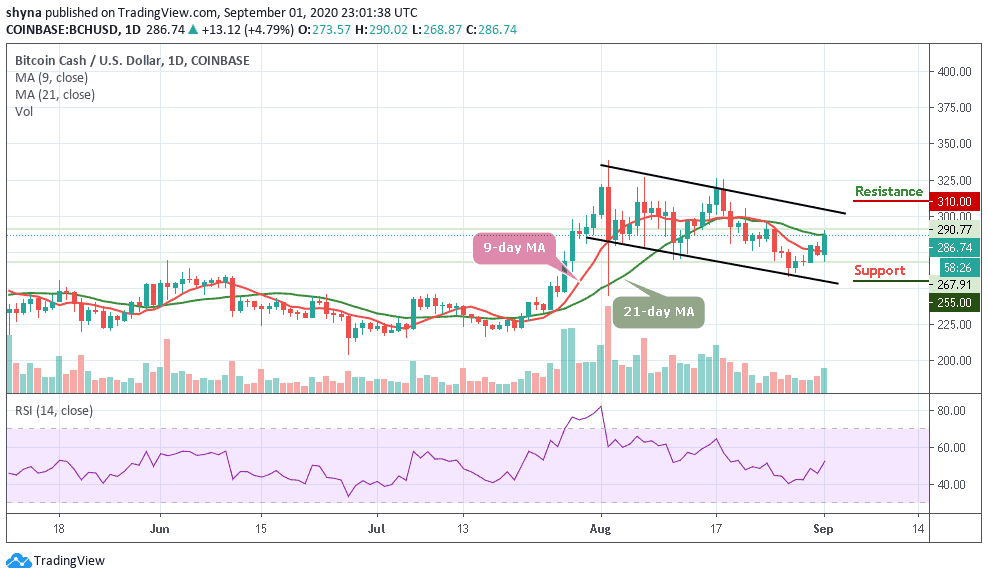
Resistance levels: $260, $270, $280
Support levels: $190, $180, $170
BCH/USD is currently struggling with the bearish pressure that continues to dominate the entire crypto landscape. A few actions were witnessed to the upside over the past few days. However, the zone between $214 and $240 stayed intact as the key support level. The bulls are keen to ensure that the price stays above the channel before today’s dips into the $219 support zone.
What to Expect from Bitcoin Cash (BCH)
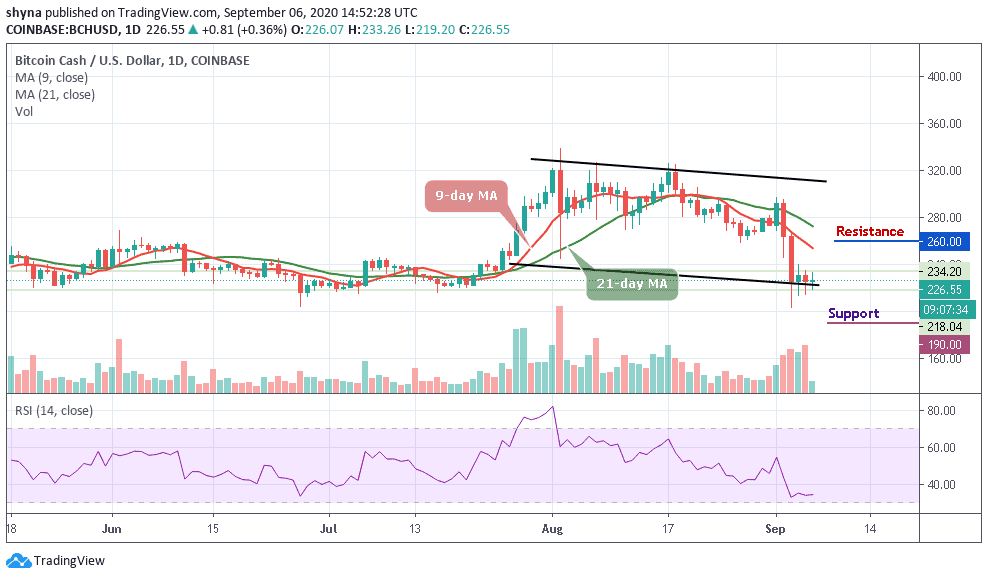
Despite the fact that the BCH price reached as high as $240 a couple of days ago, it was unable to maintain its performance and started to recede downwards. At the moment, BCH/USD moves below the 9-day and 21-day moving averages but the present trend indicates that BCH prices may continue to move sideways before the day runs out.
However, if the market drives below the lower boundary of the channel, the BCH price could slump to the supports at $190, $180, and $170, bringing the price to a new monthly low as the RSI (14) moves in the same direction below 35-level. Meanwhile, if the bulls can hold the support at $225, a very strong buying pressure may likely take the price to $250 resistance. While trading at this level, a bullish continuation could touch the resistance levels at $260, $270, and $280 respectively.
When compares with Bitcoin, the last few days has been giving the bears an upper hand in controlling the market. Following the recent negative sign on September 2 and 3, BCH/BTC may continue to follow the downward trend in as much as the sellers keep on pumping more pressure into the market.
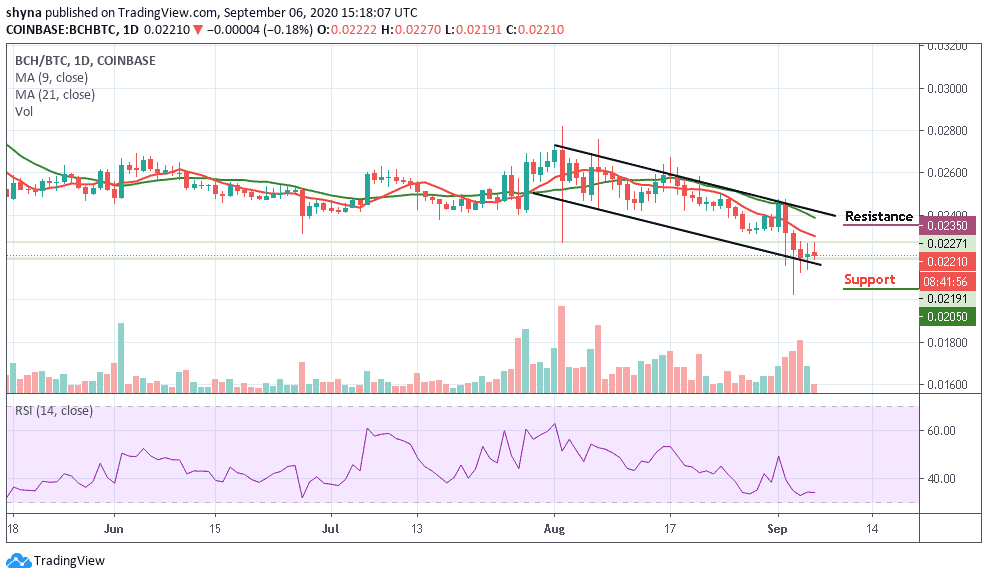
Moreover, the market price may likely resume an upward trend if the bulls can hold the price at 2210 SAT and then cross above the 9-day and 21-day moving averages to hit the resistance level of 2350 SAT and above. However, as the RSI (14) moves below 35-level, a retest could lower the price of the coin to the supports of the 2050 SAT and below.
Join Our Telegram channel to stay up to date on breaking news coverage