Join Our Telegram channel to stay up to date on breaking news coverage
BCH Price Prediction – February 26
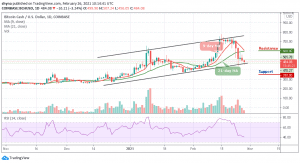
Today, the price of Bitcoin Cash briefly slides below $500 after rejection at the $507 level.
BCH/USD Market
Key Levels:
Resistance levels: $600, $650, $700
Support levels: $350, $300, $250

BCH/USD price is seen rolling down as revealed by the daily chart. Apparently, the current downfall was expected as the altcoins were hitting huge counters, and the market had to come under selling pressure. However, should Bitcoin Cash fall below the 9-day and 21-day moving averages, the bears might come back to dominate the market.
Where is BCH Price Going Next?
On the upside, a sustained move above the moving averages may ease the initial downside pressure and create momentum for the bulls with the focus to move the market to the next resistance levels of $600, $650, and $700 respectively. At the moment, the technical indicator RSI (14) prepares to move below 40-level, which indicates that the downward momentum may likely continue.
Nevertheless, as the 9-day MA is trying to cross below the 21-day MA, the coin may remain on the negative side. However, it is important to note that the recent consolidation within the channel is necessary for the bullish action. Moreover, as the daily chart reveals, the market price may likely cross below the lower boundary of the channel and once this is done, BCH/USD may reach the critical supports at $350, $300, and $250 respectively.
When compares with Bitcoin, one thing to note here is that the market keeps following the downward trend and another short-term bearish breakout is most likely to play out because the technical indicator RSI (14) is moving below 40-level and when crossing into the oversold region, the price could find the nearest support level at 915 SAT.

Therefore, if the buyers could gather and succeed in breaking the moving averages, the market price may likely touch the next resistance level of 1300 SAT and above. In other words, a retest could lower the price to the support level of 800 SAT and below.
Join Our Telegram channel to stay up to date on breaking news coverage